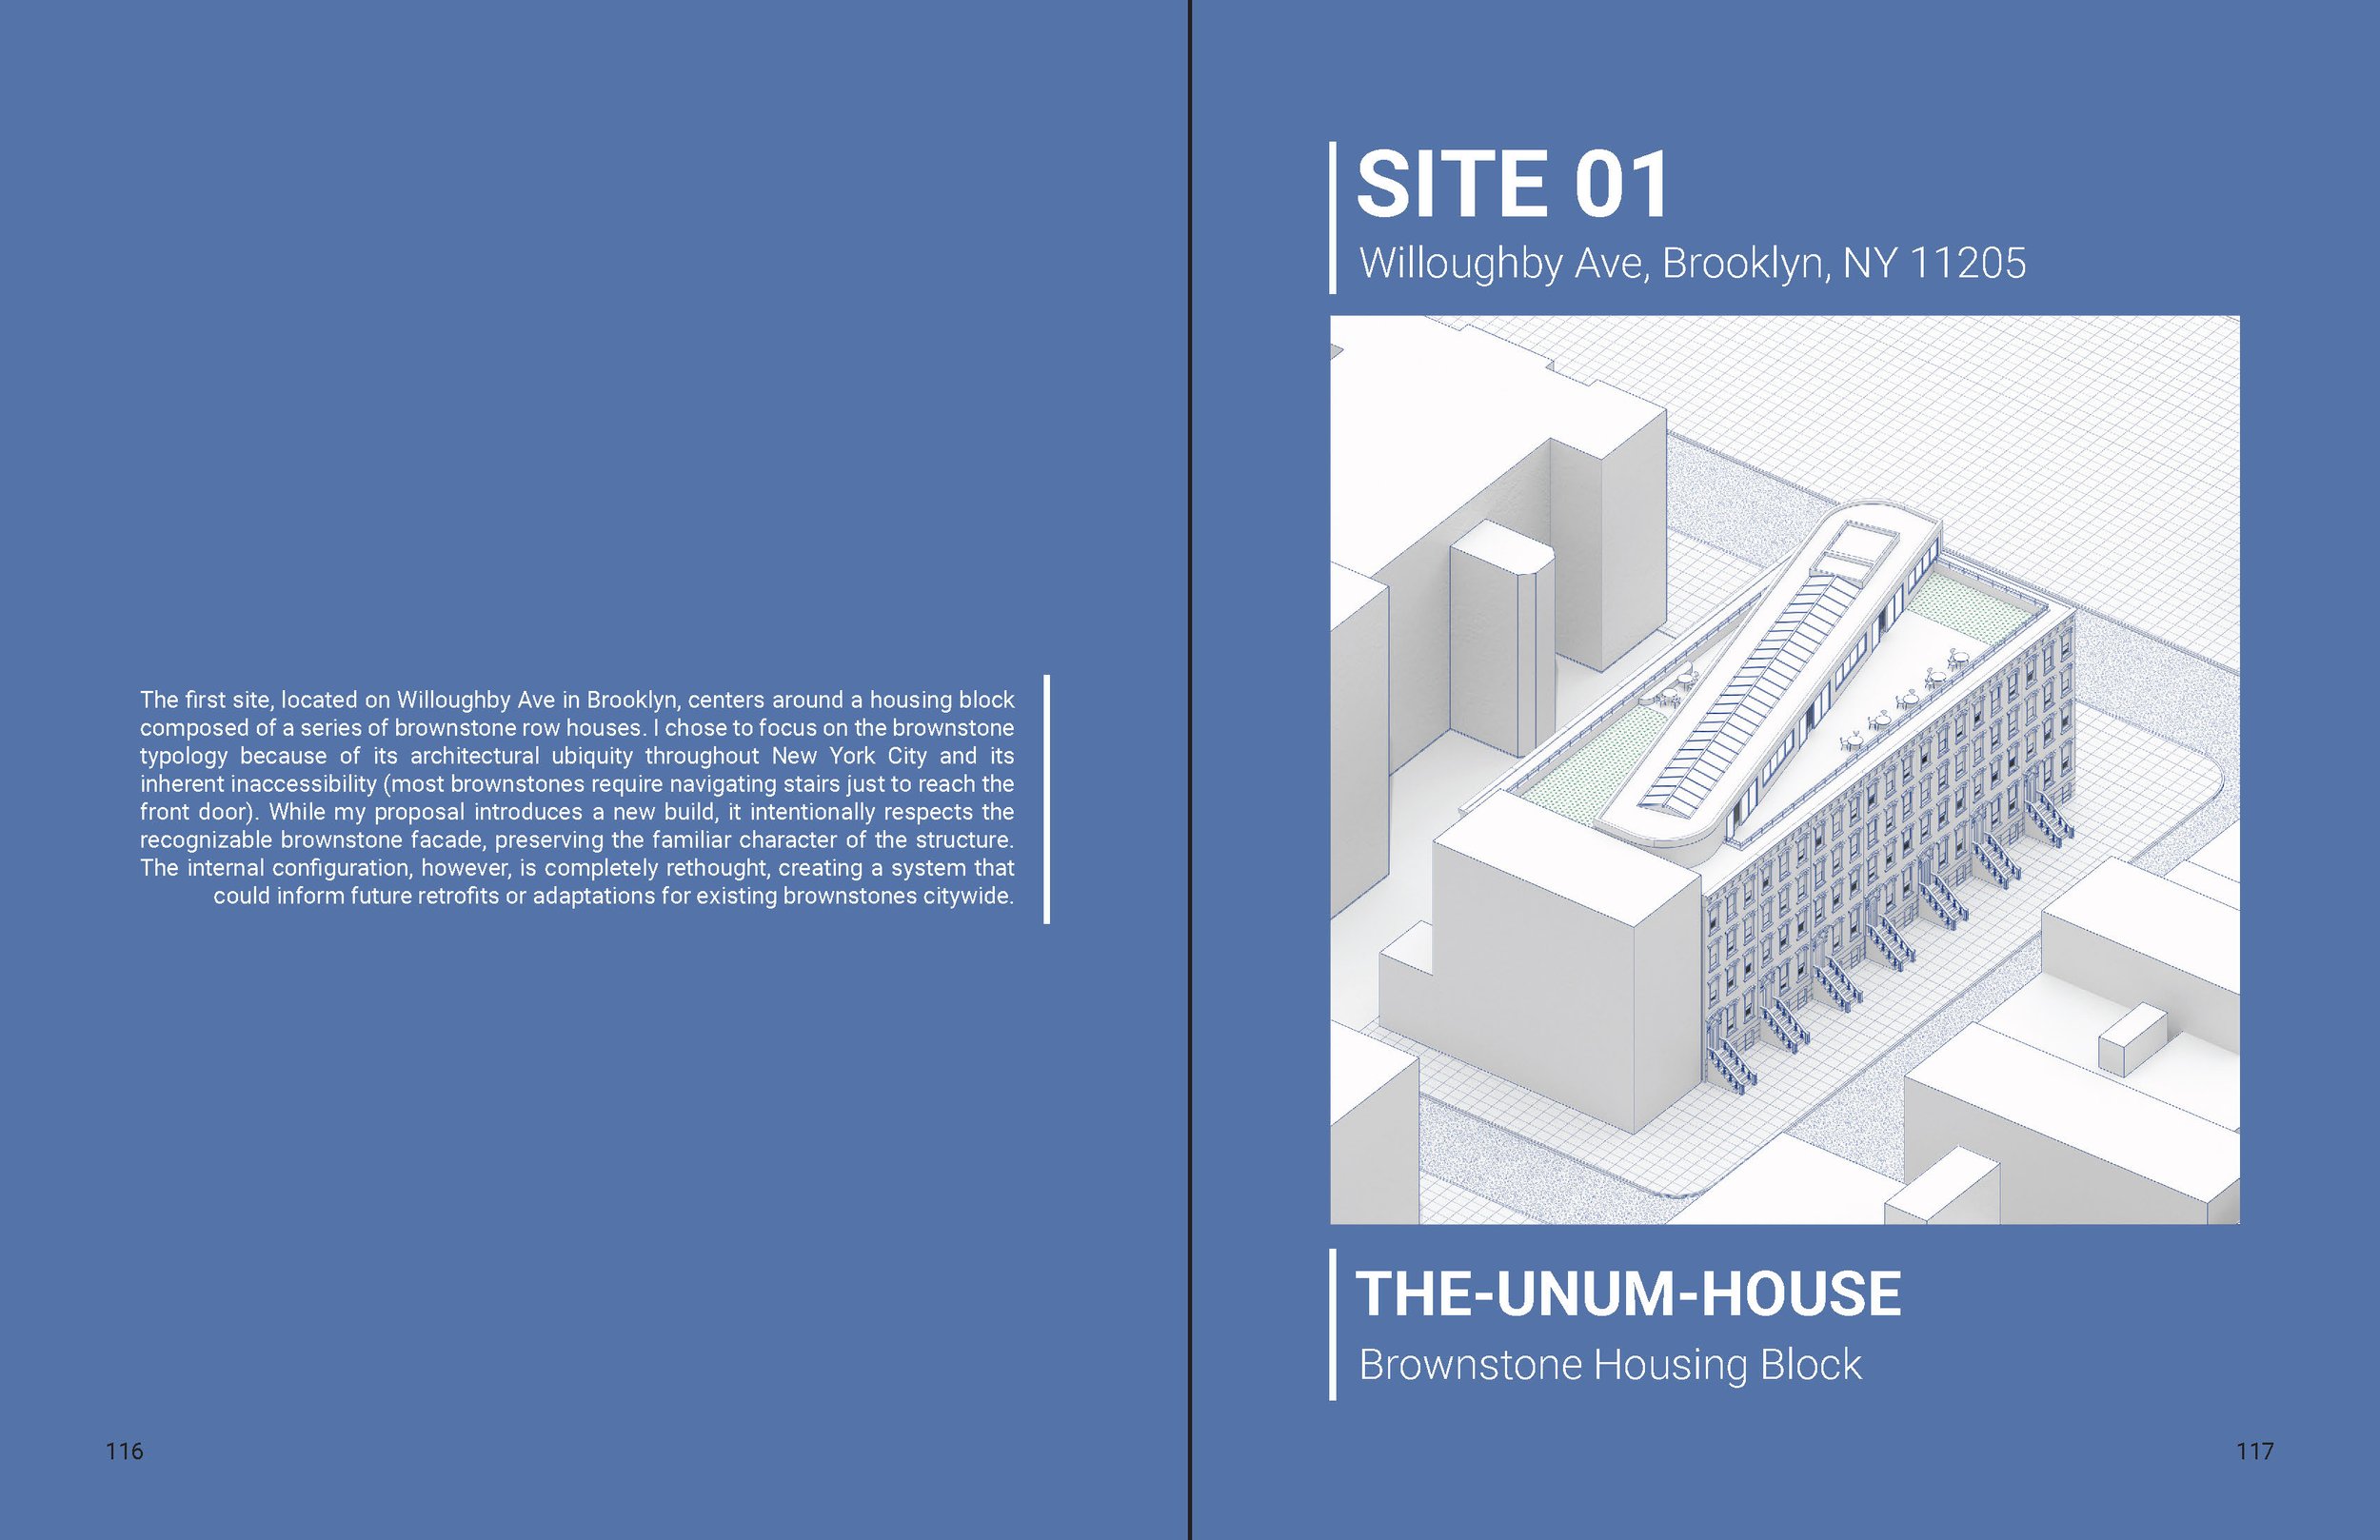
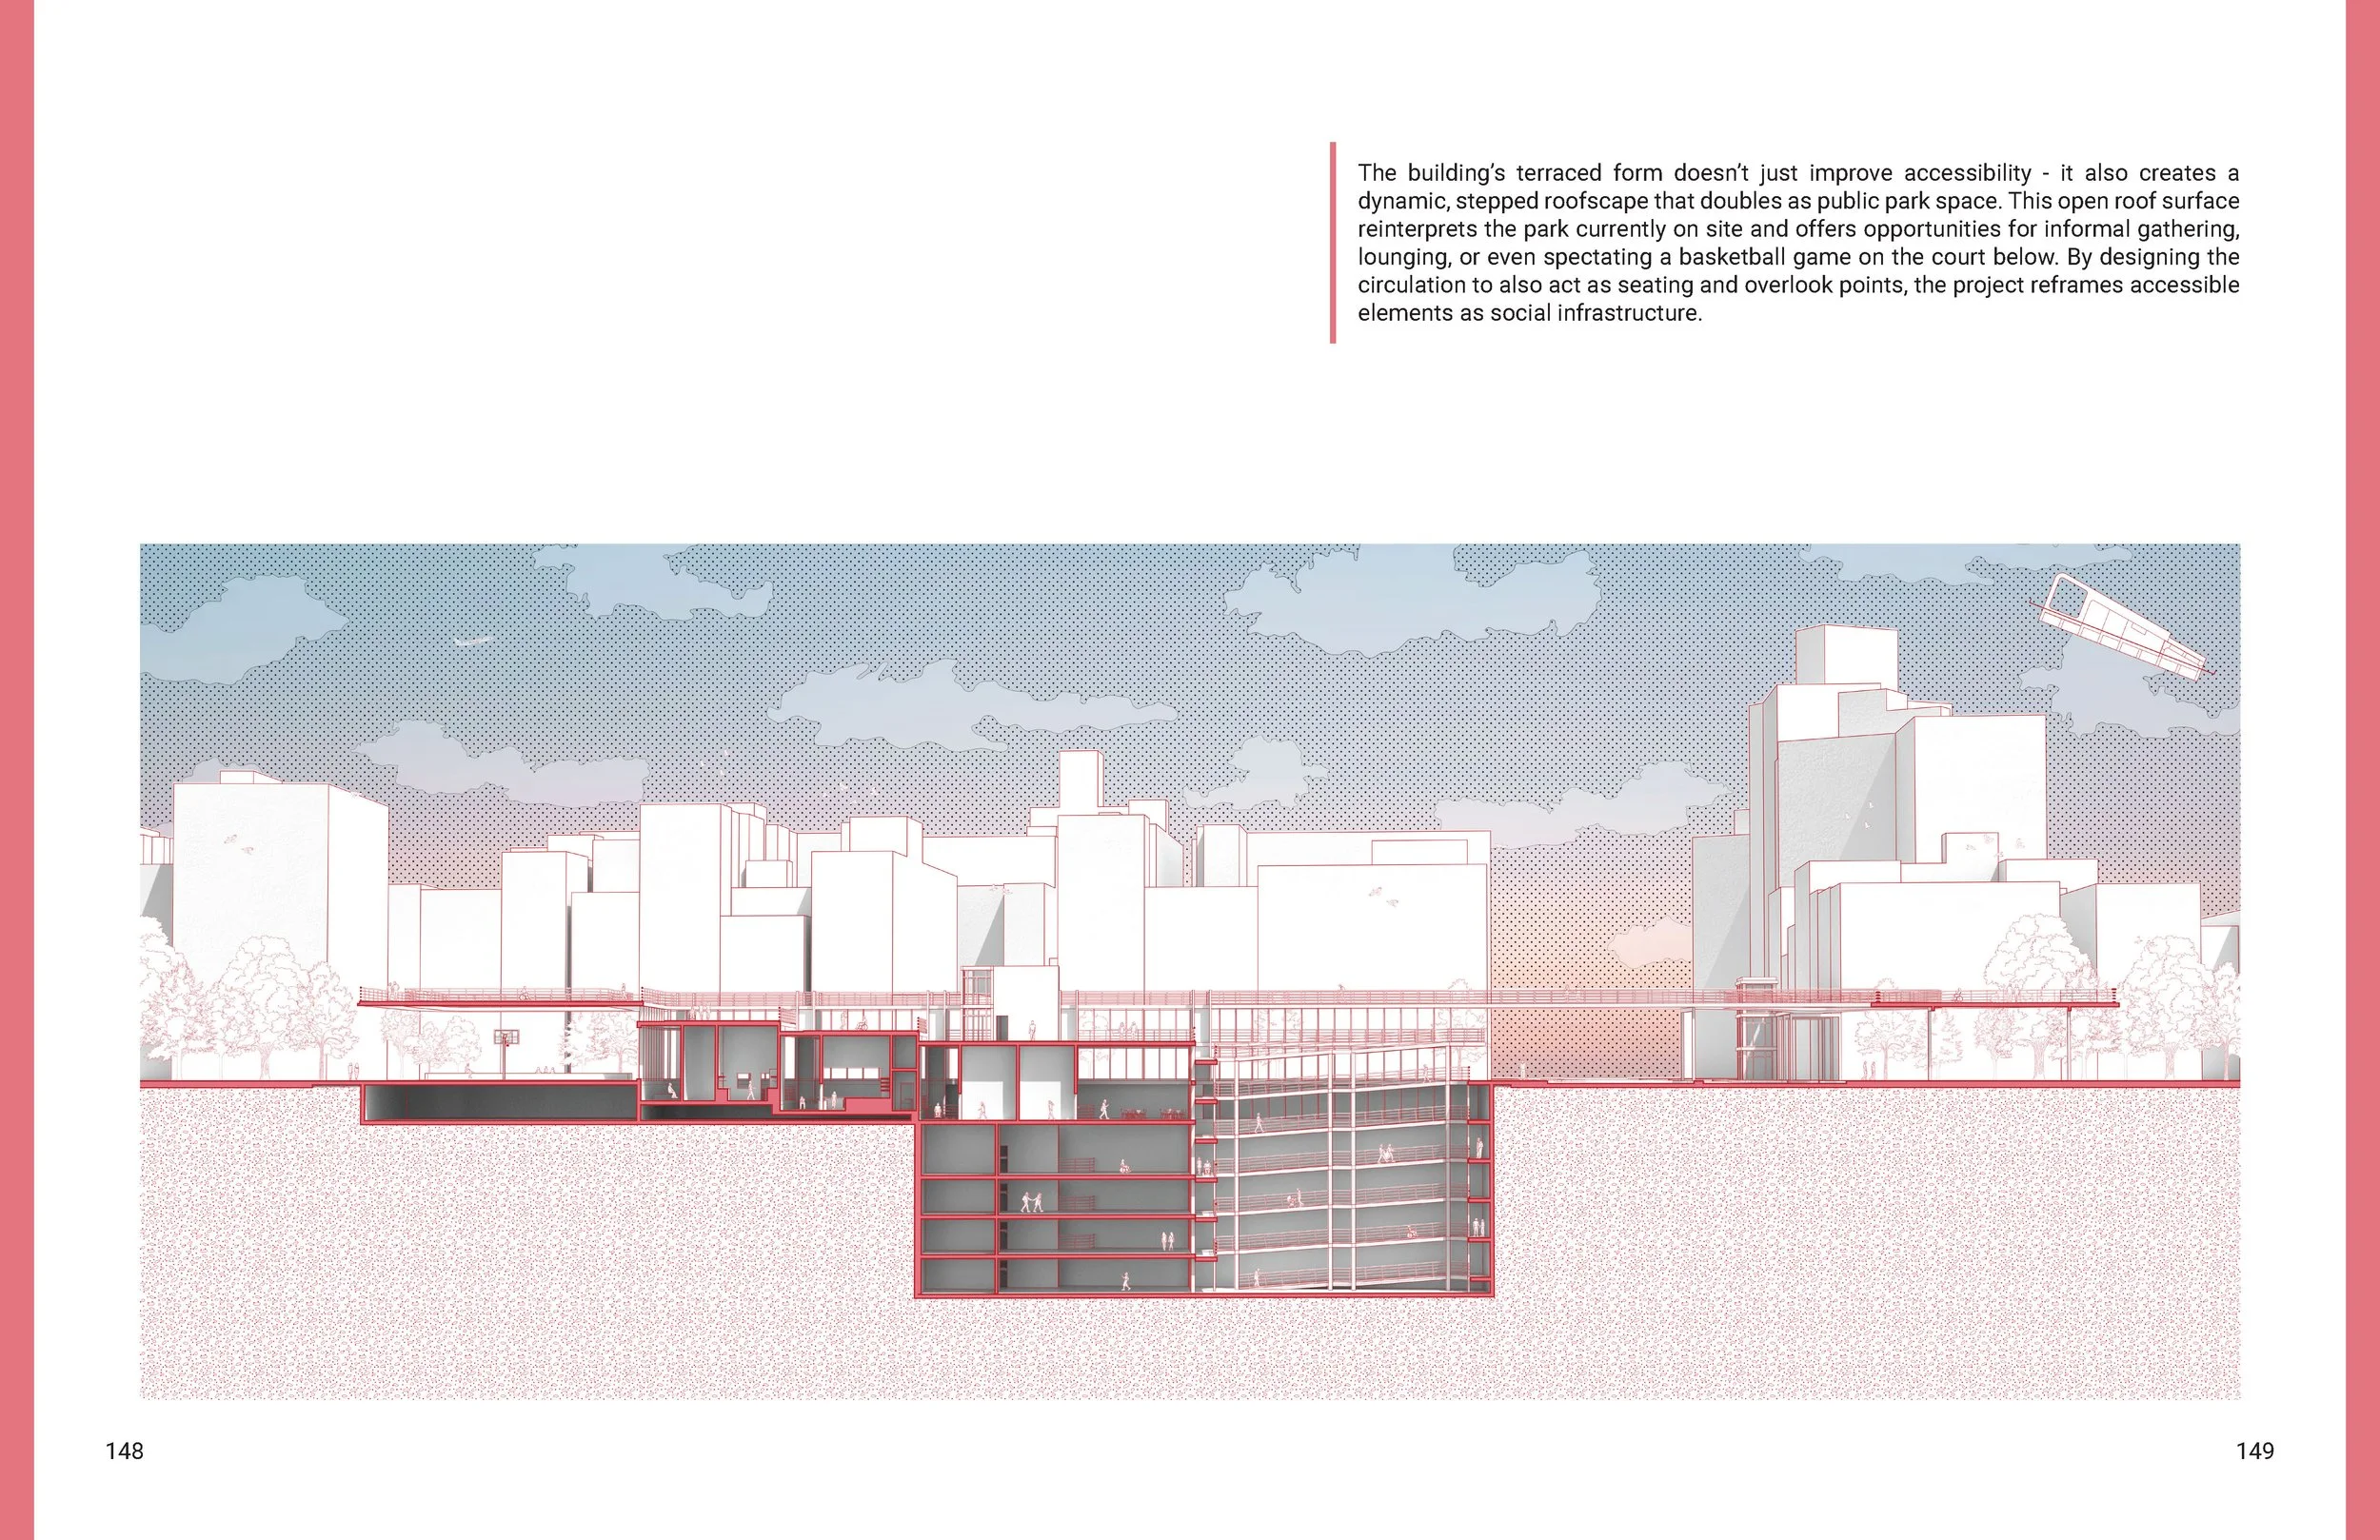
Bridging-The-Gap

SPRING 2025

CORNELL UNIVERSITY ARCH 5102 THESIS

PROFESSOR(S): ANDREW LUCIA & KATHARINA KRAL

THE GAP | THE ISSUE AT HAND

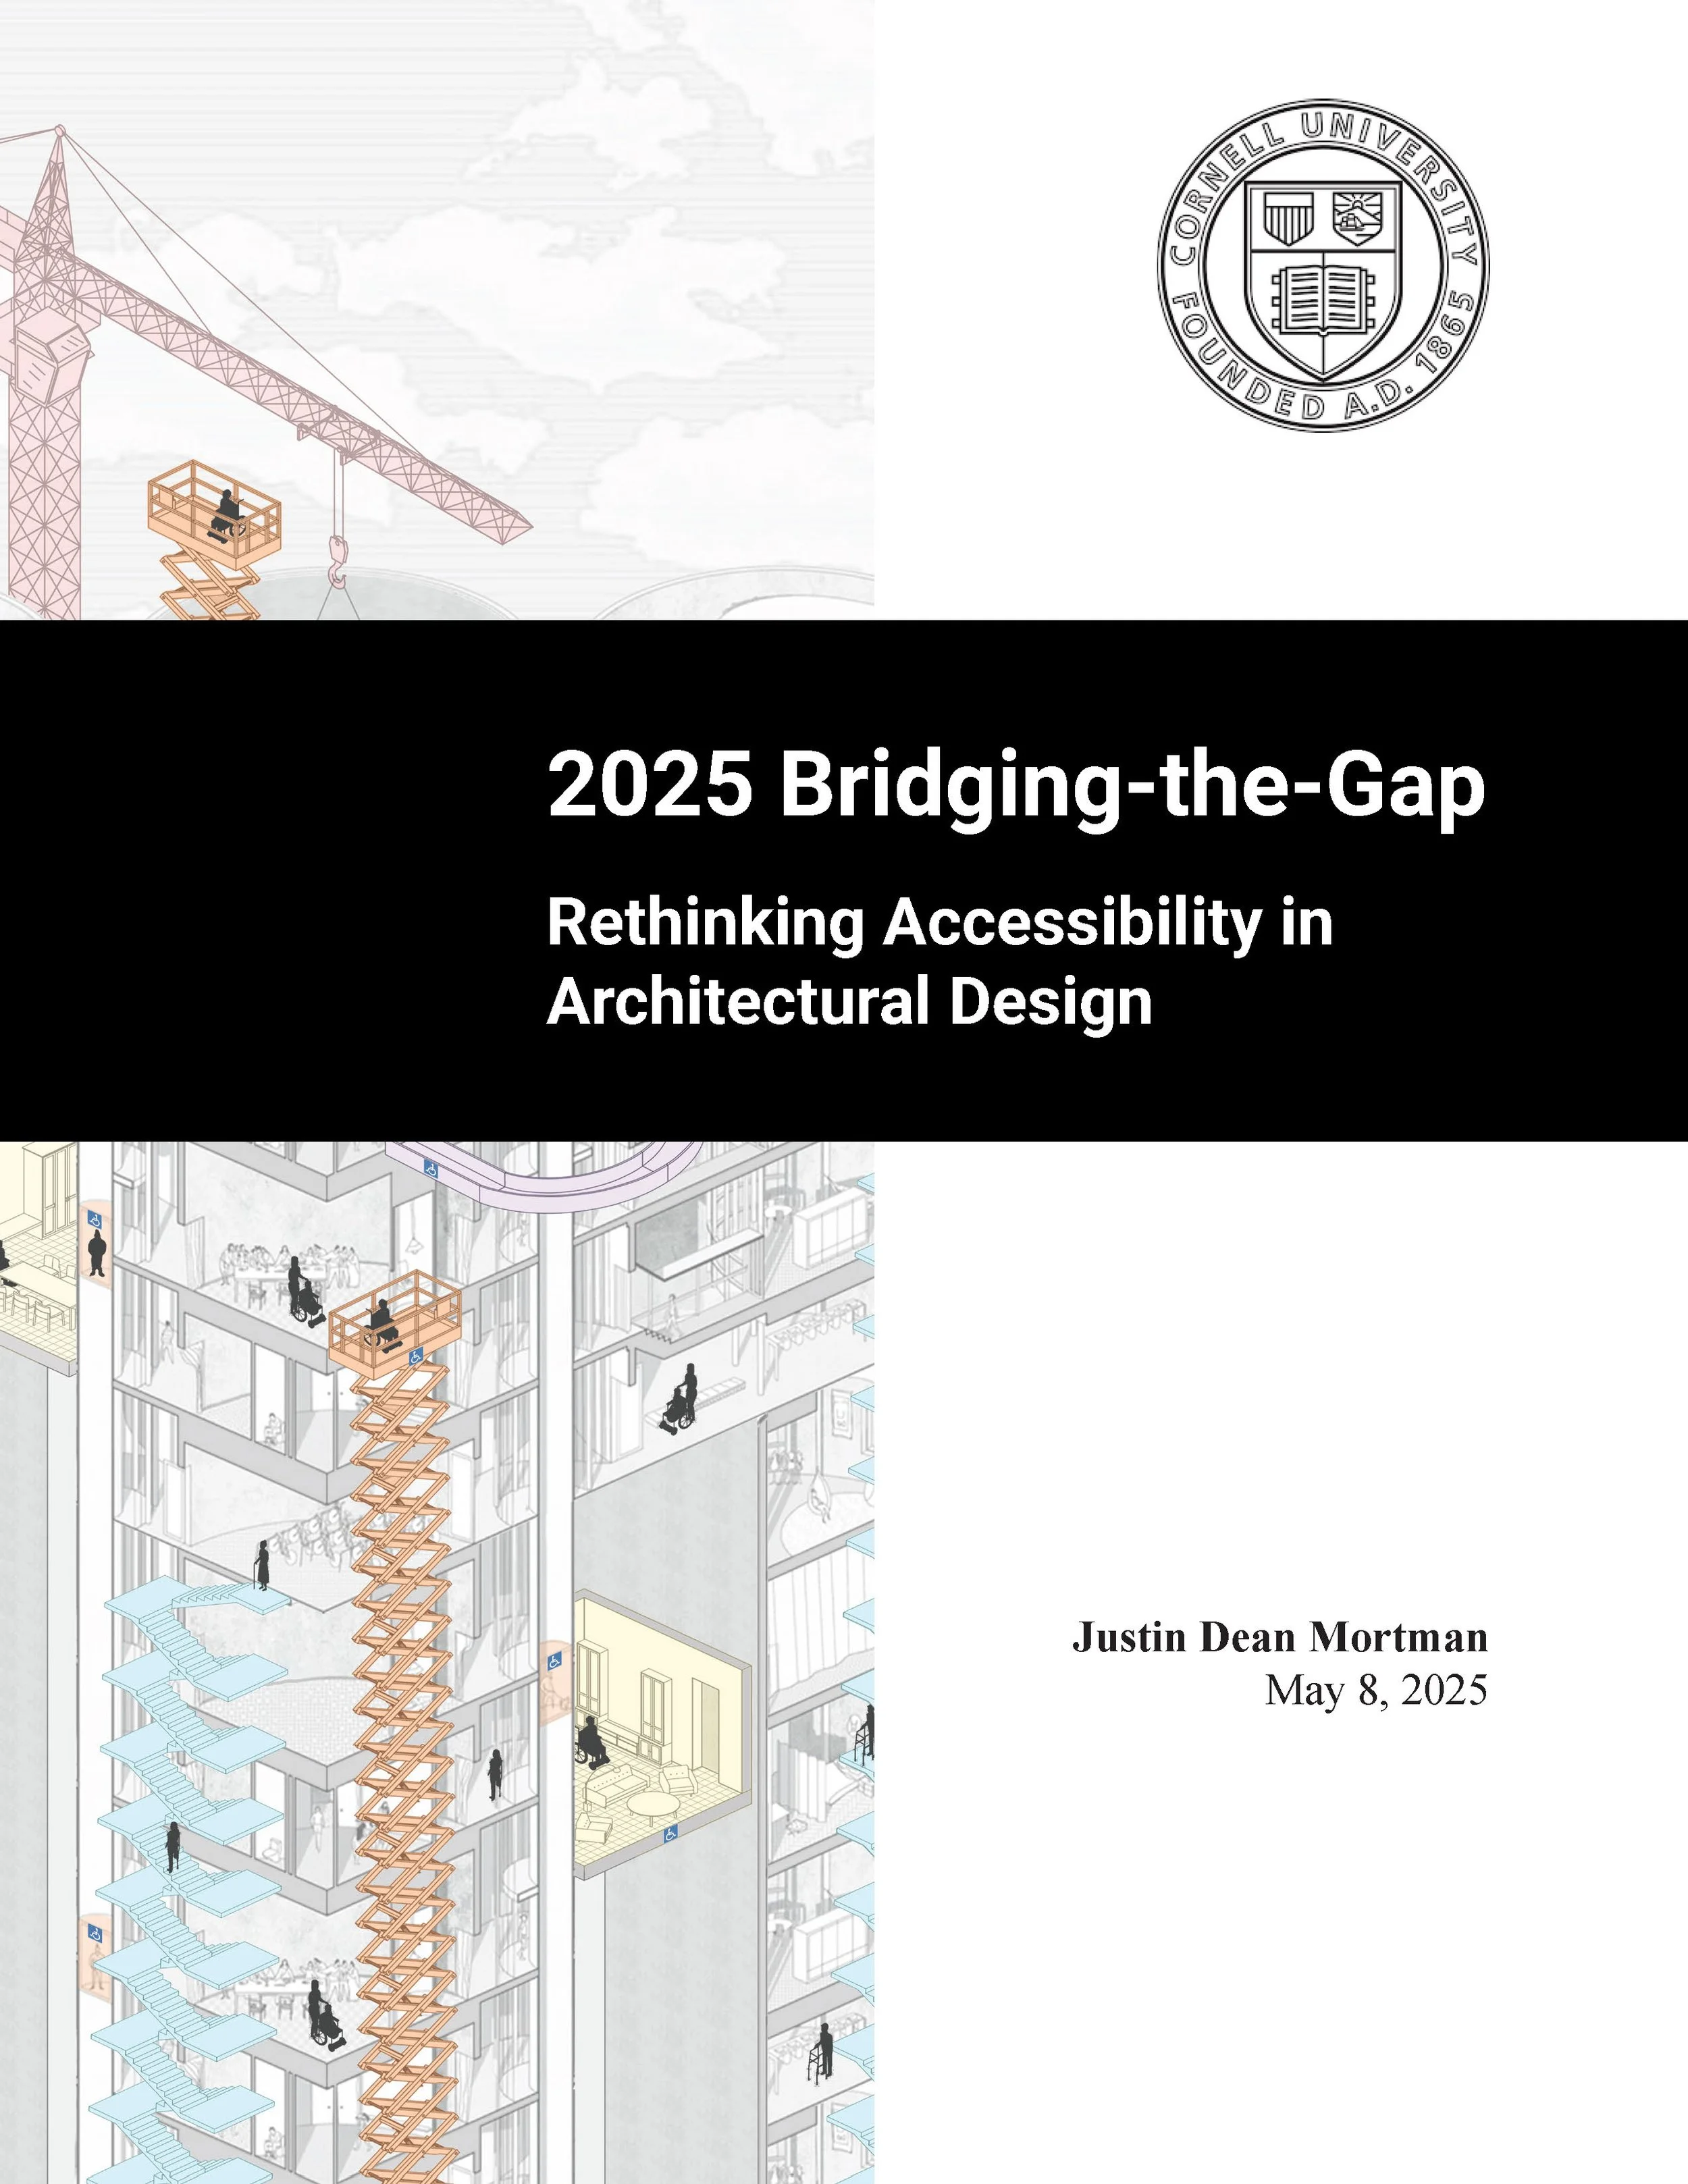
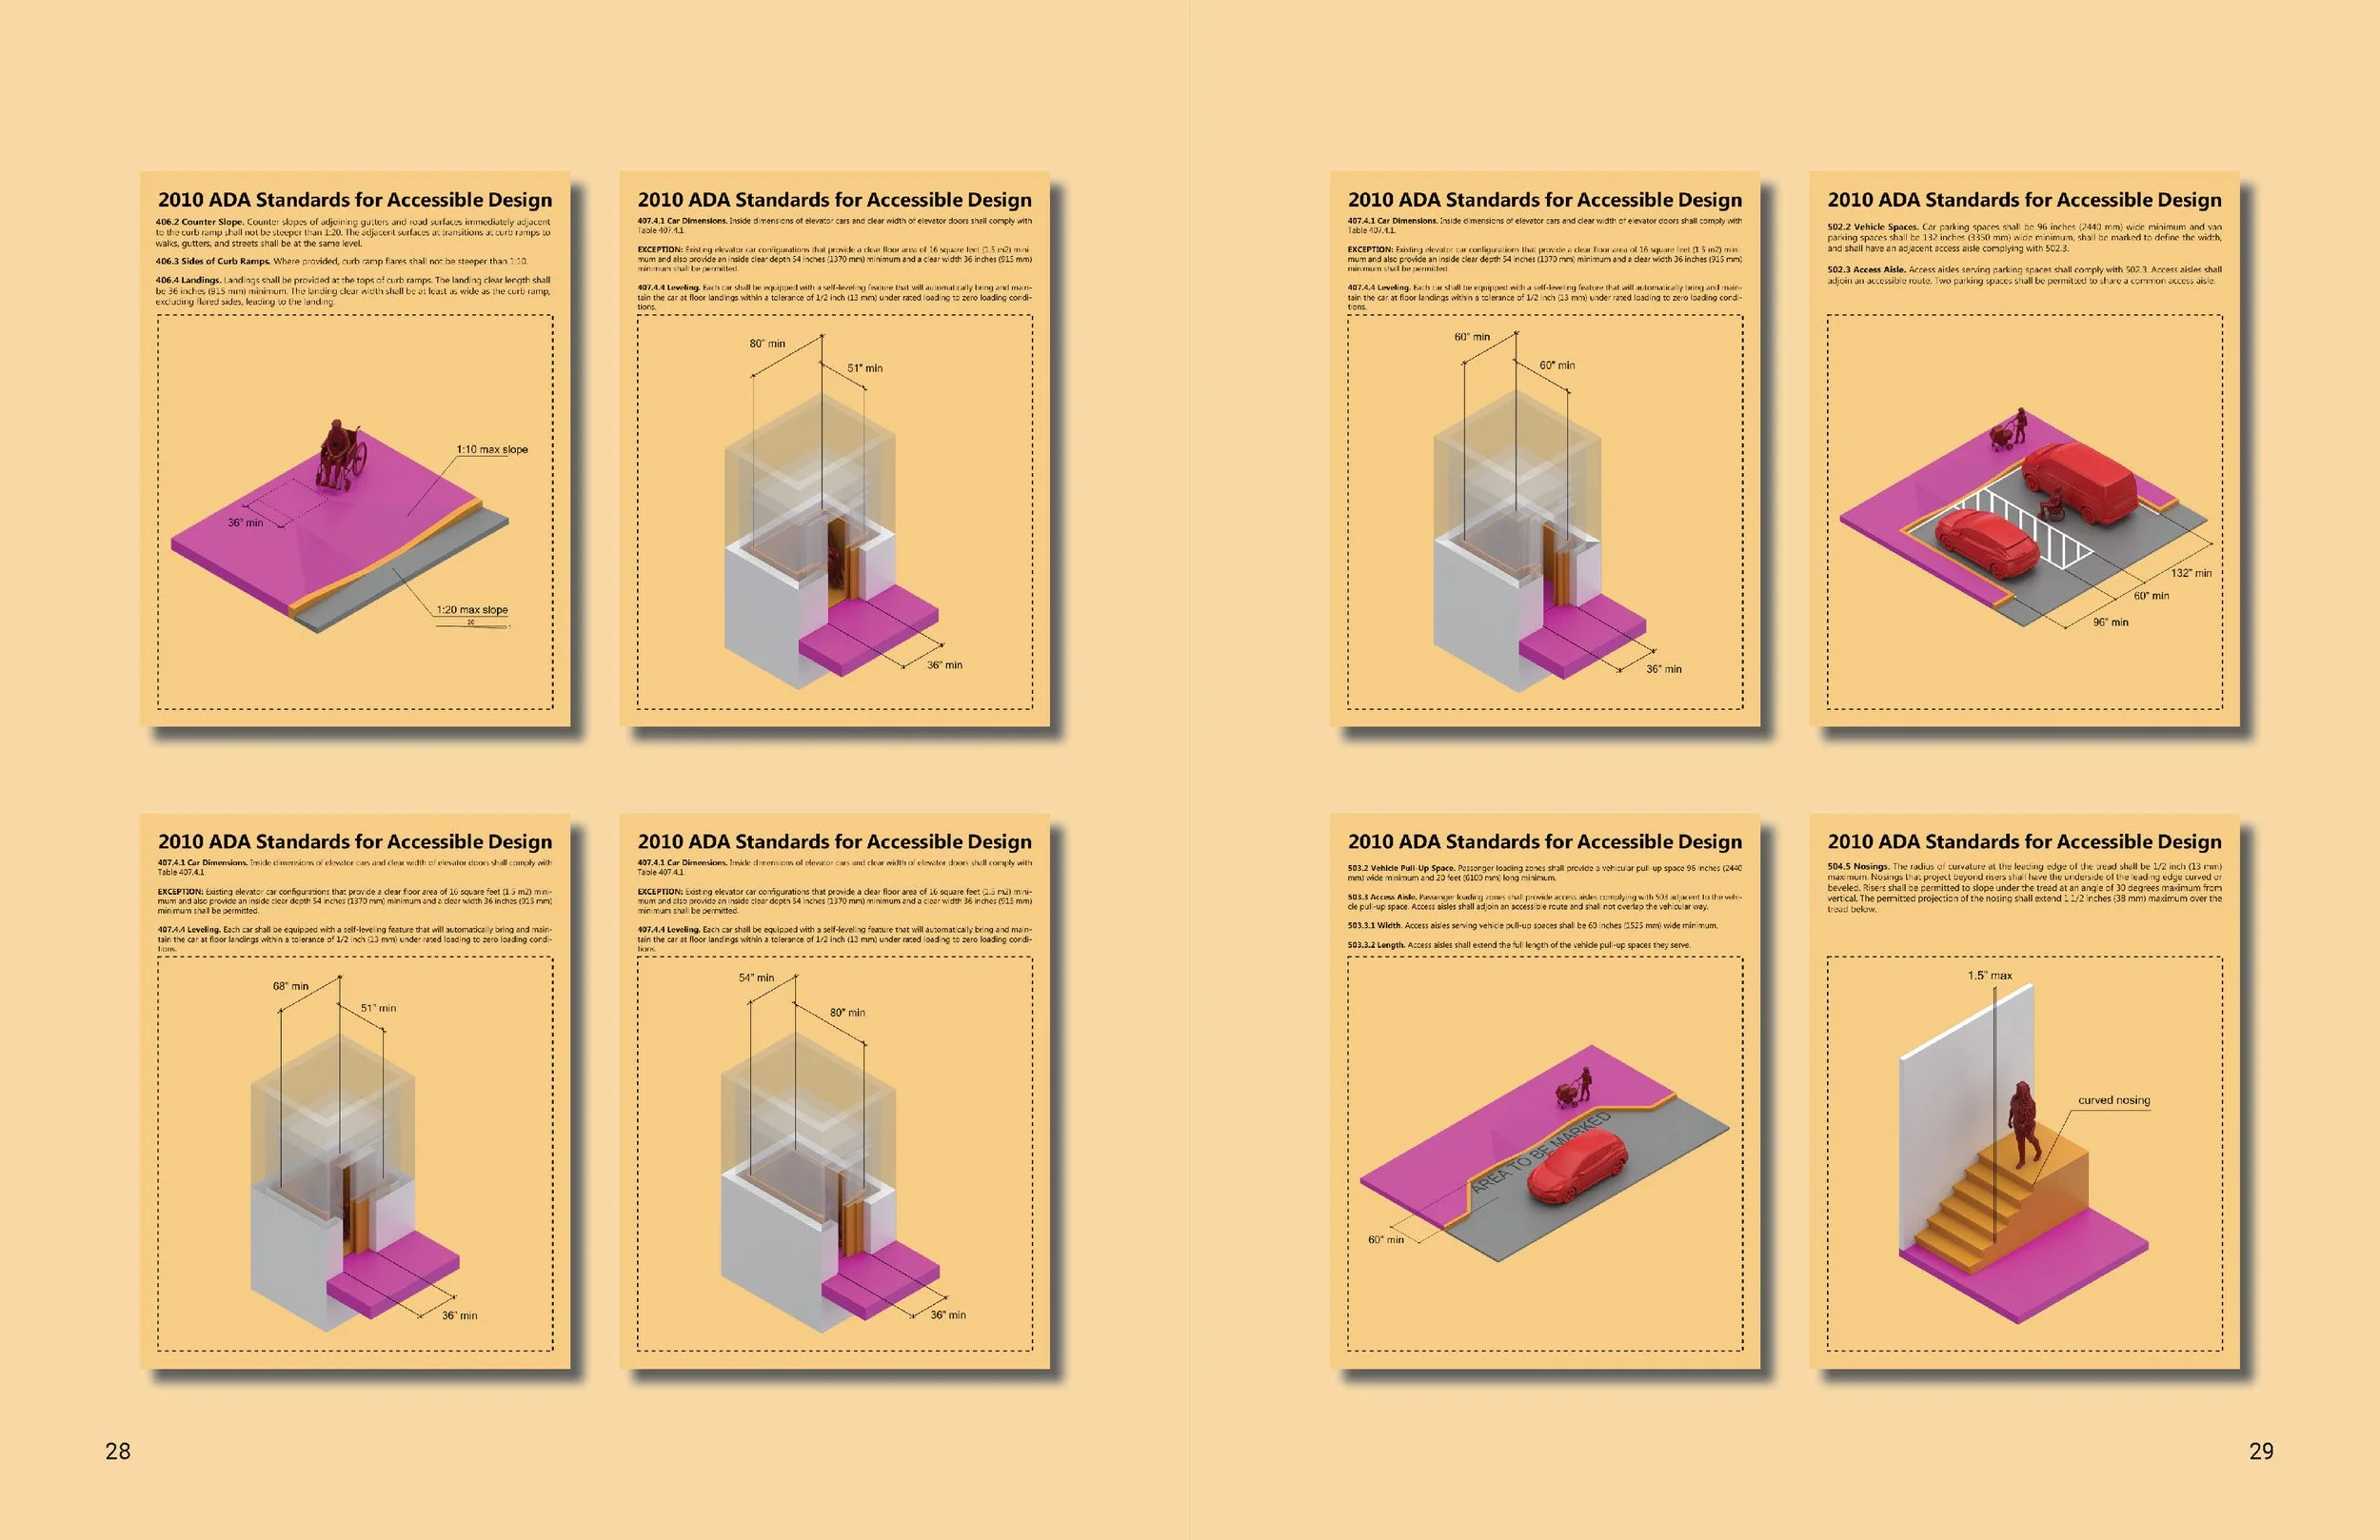
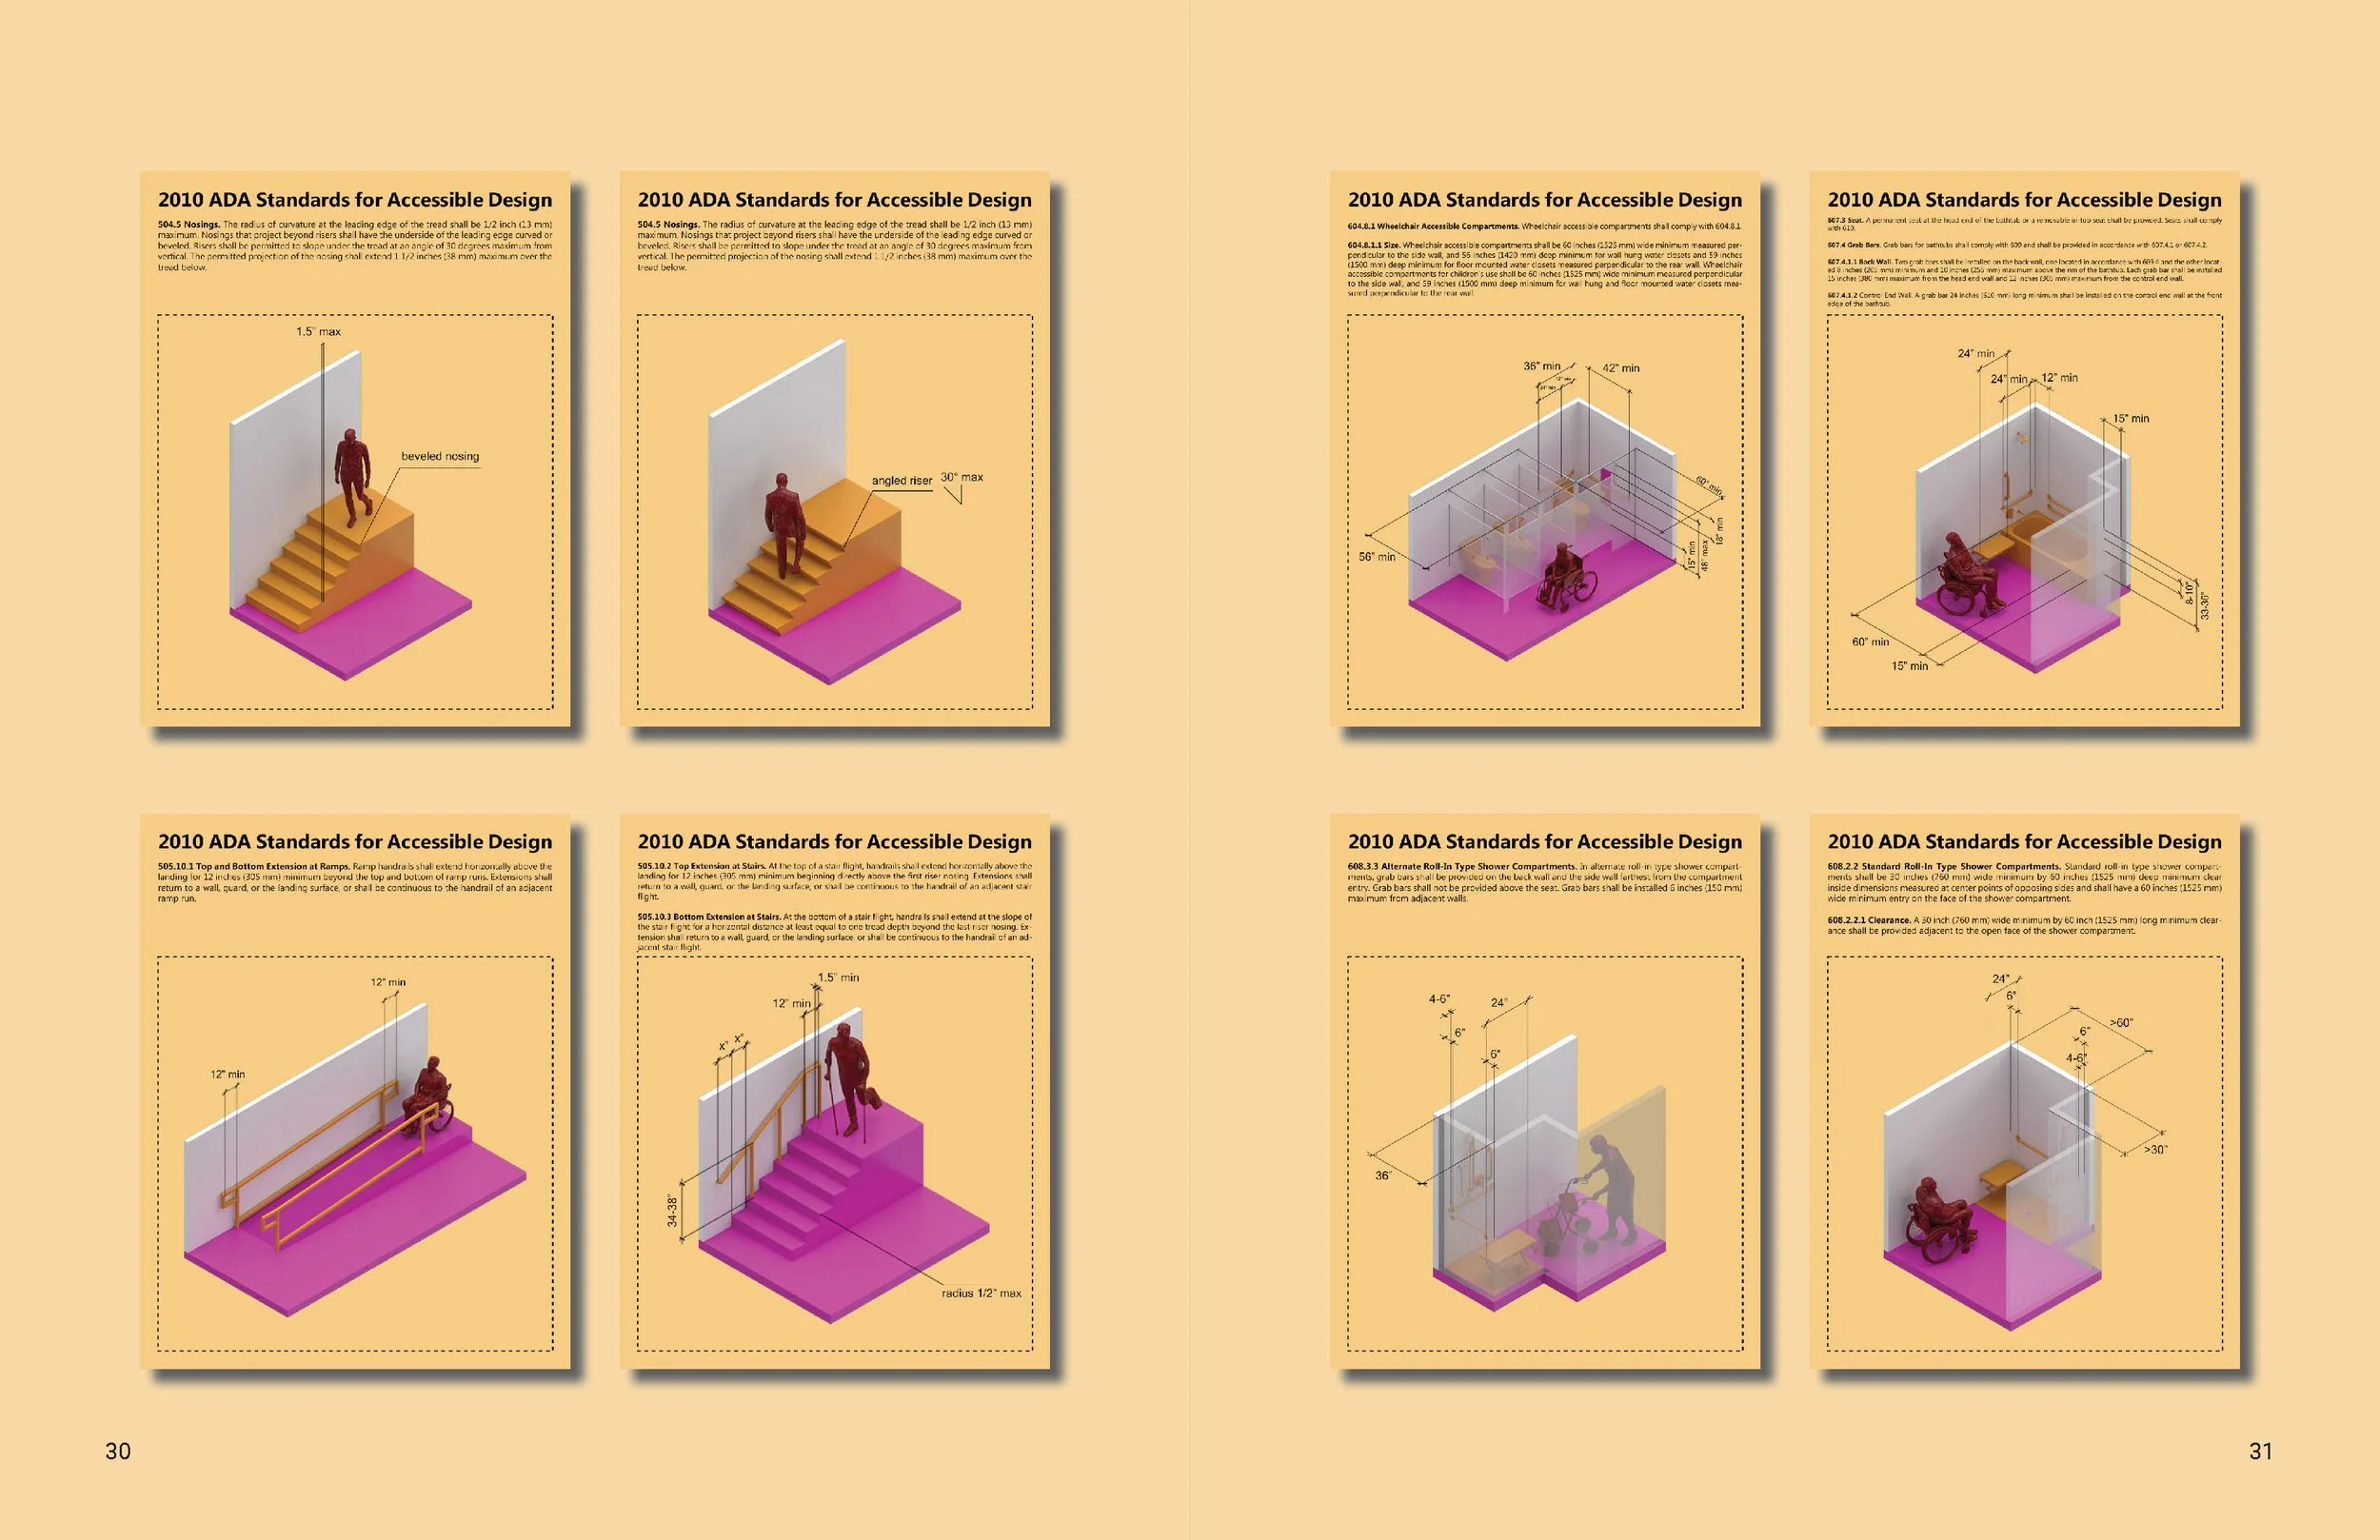
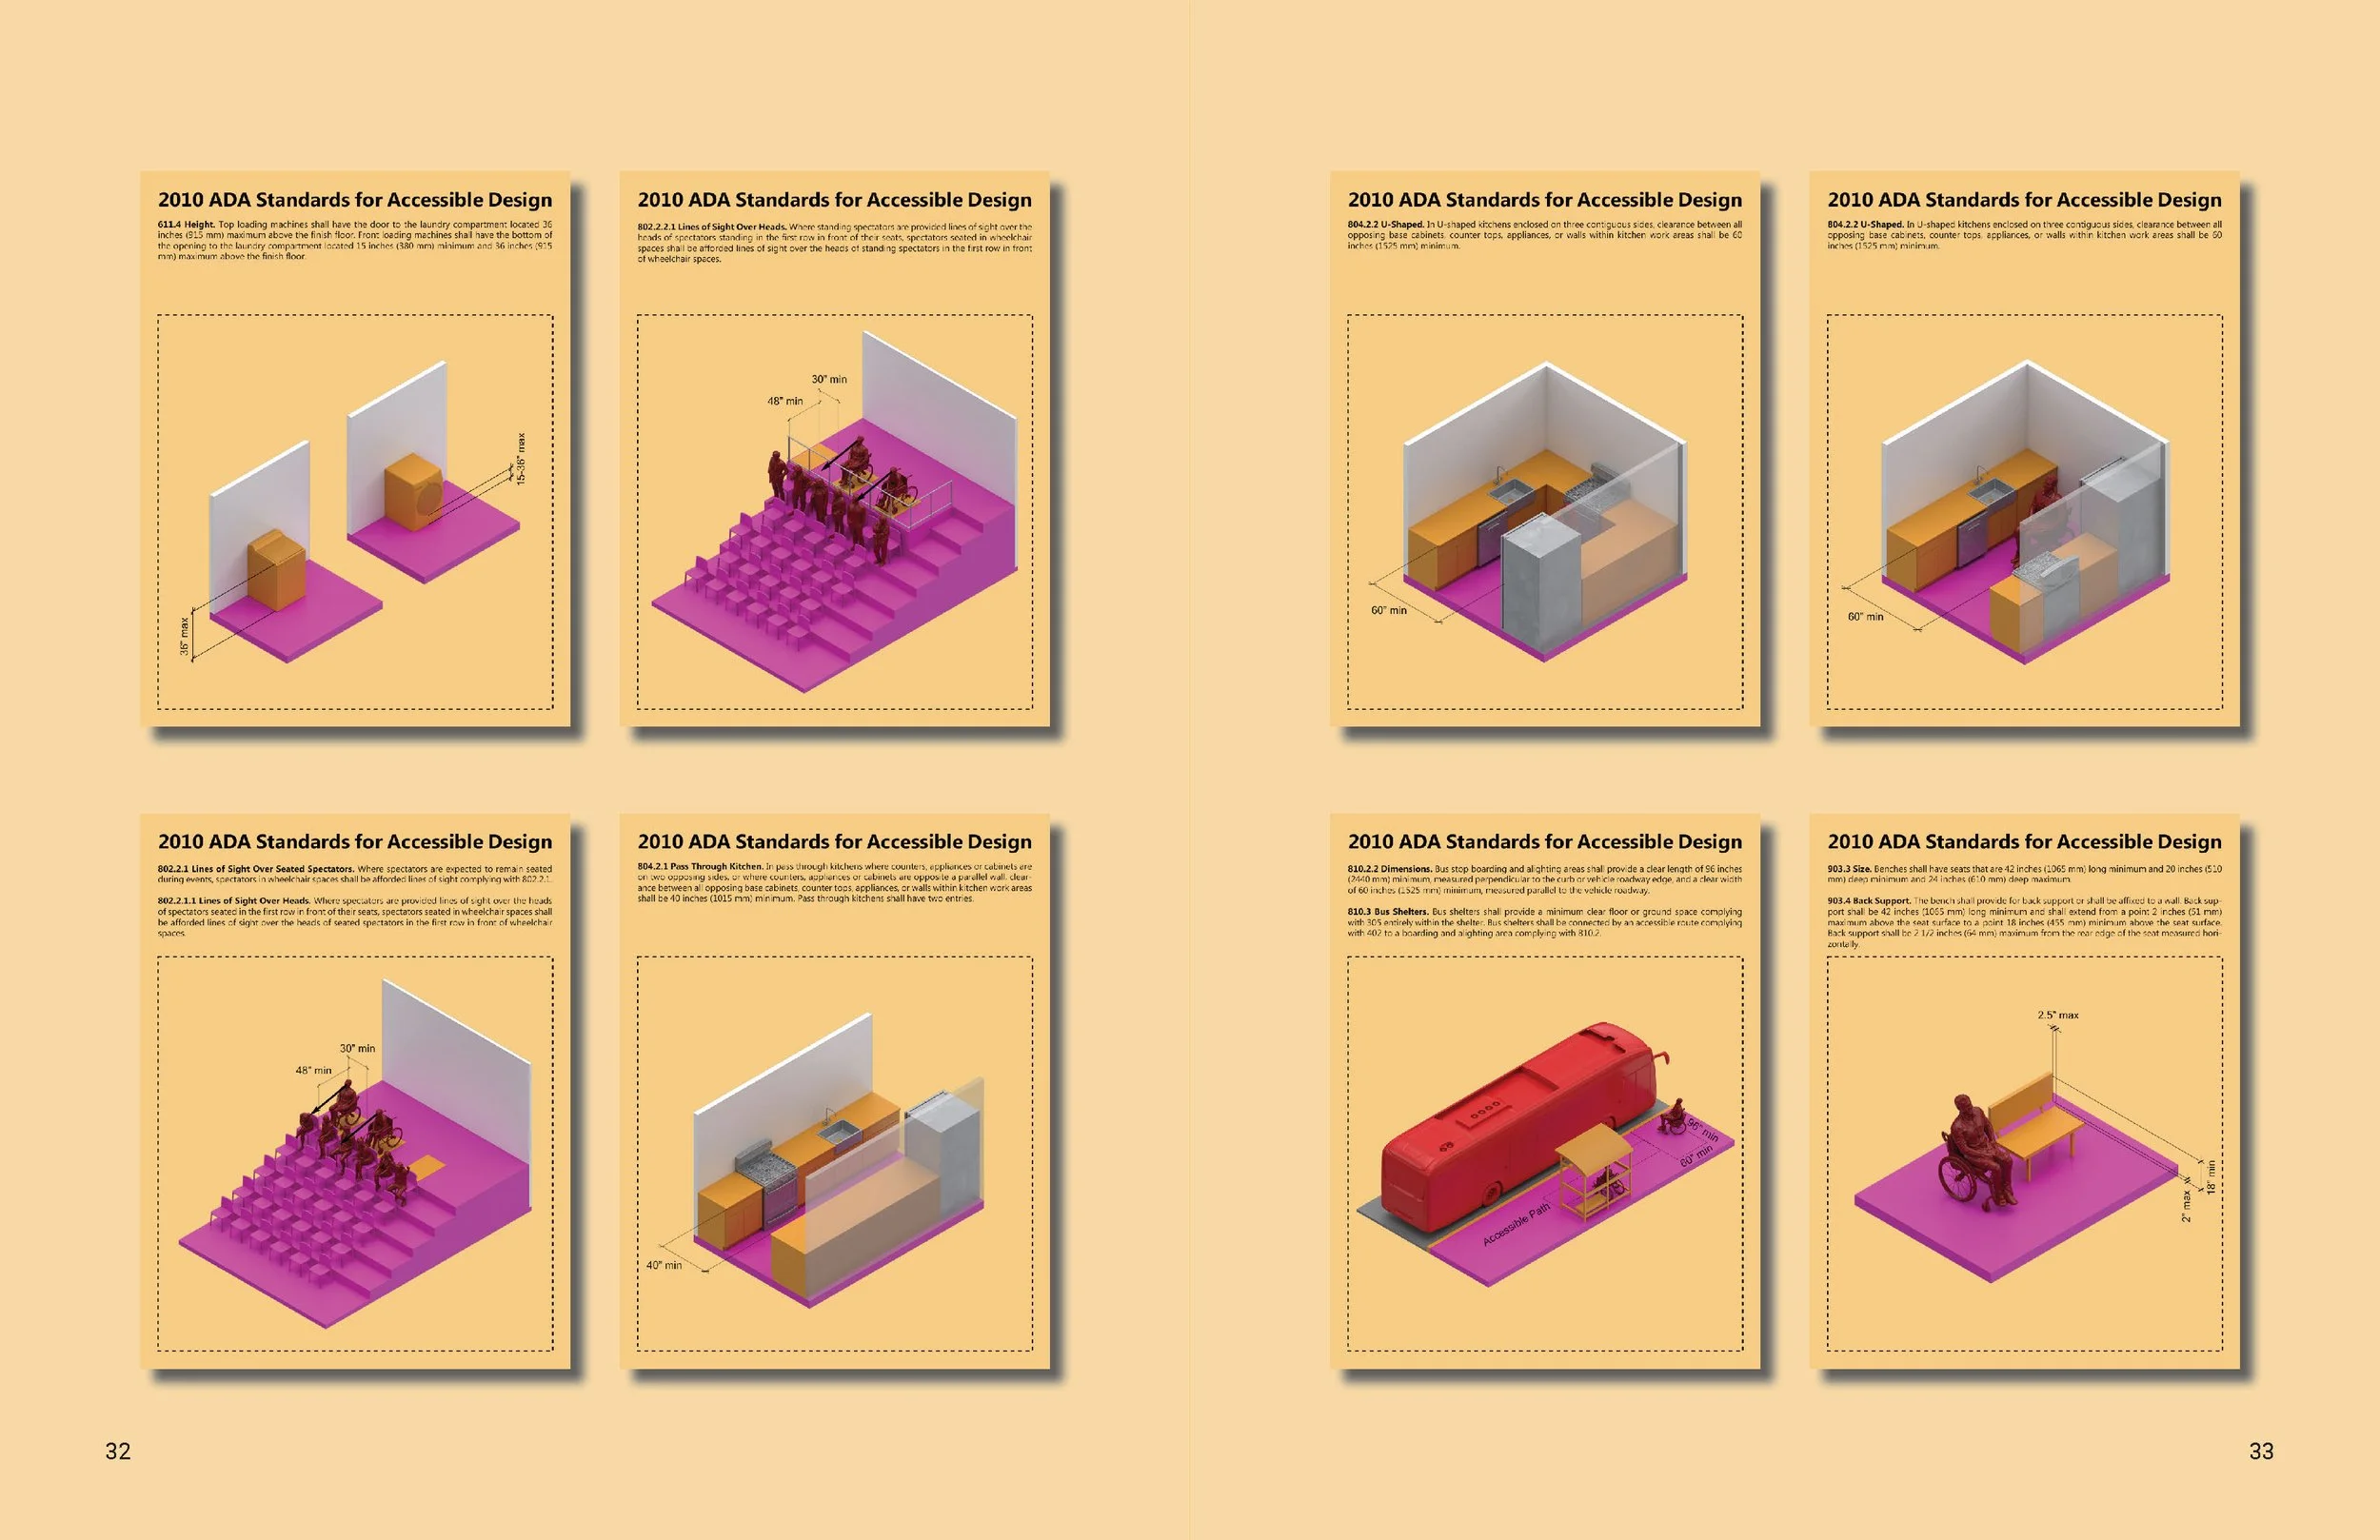
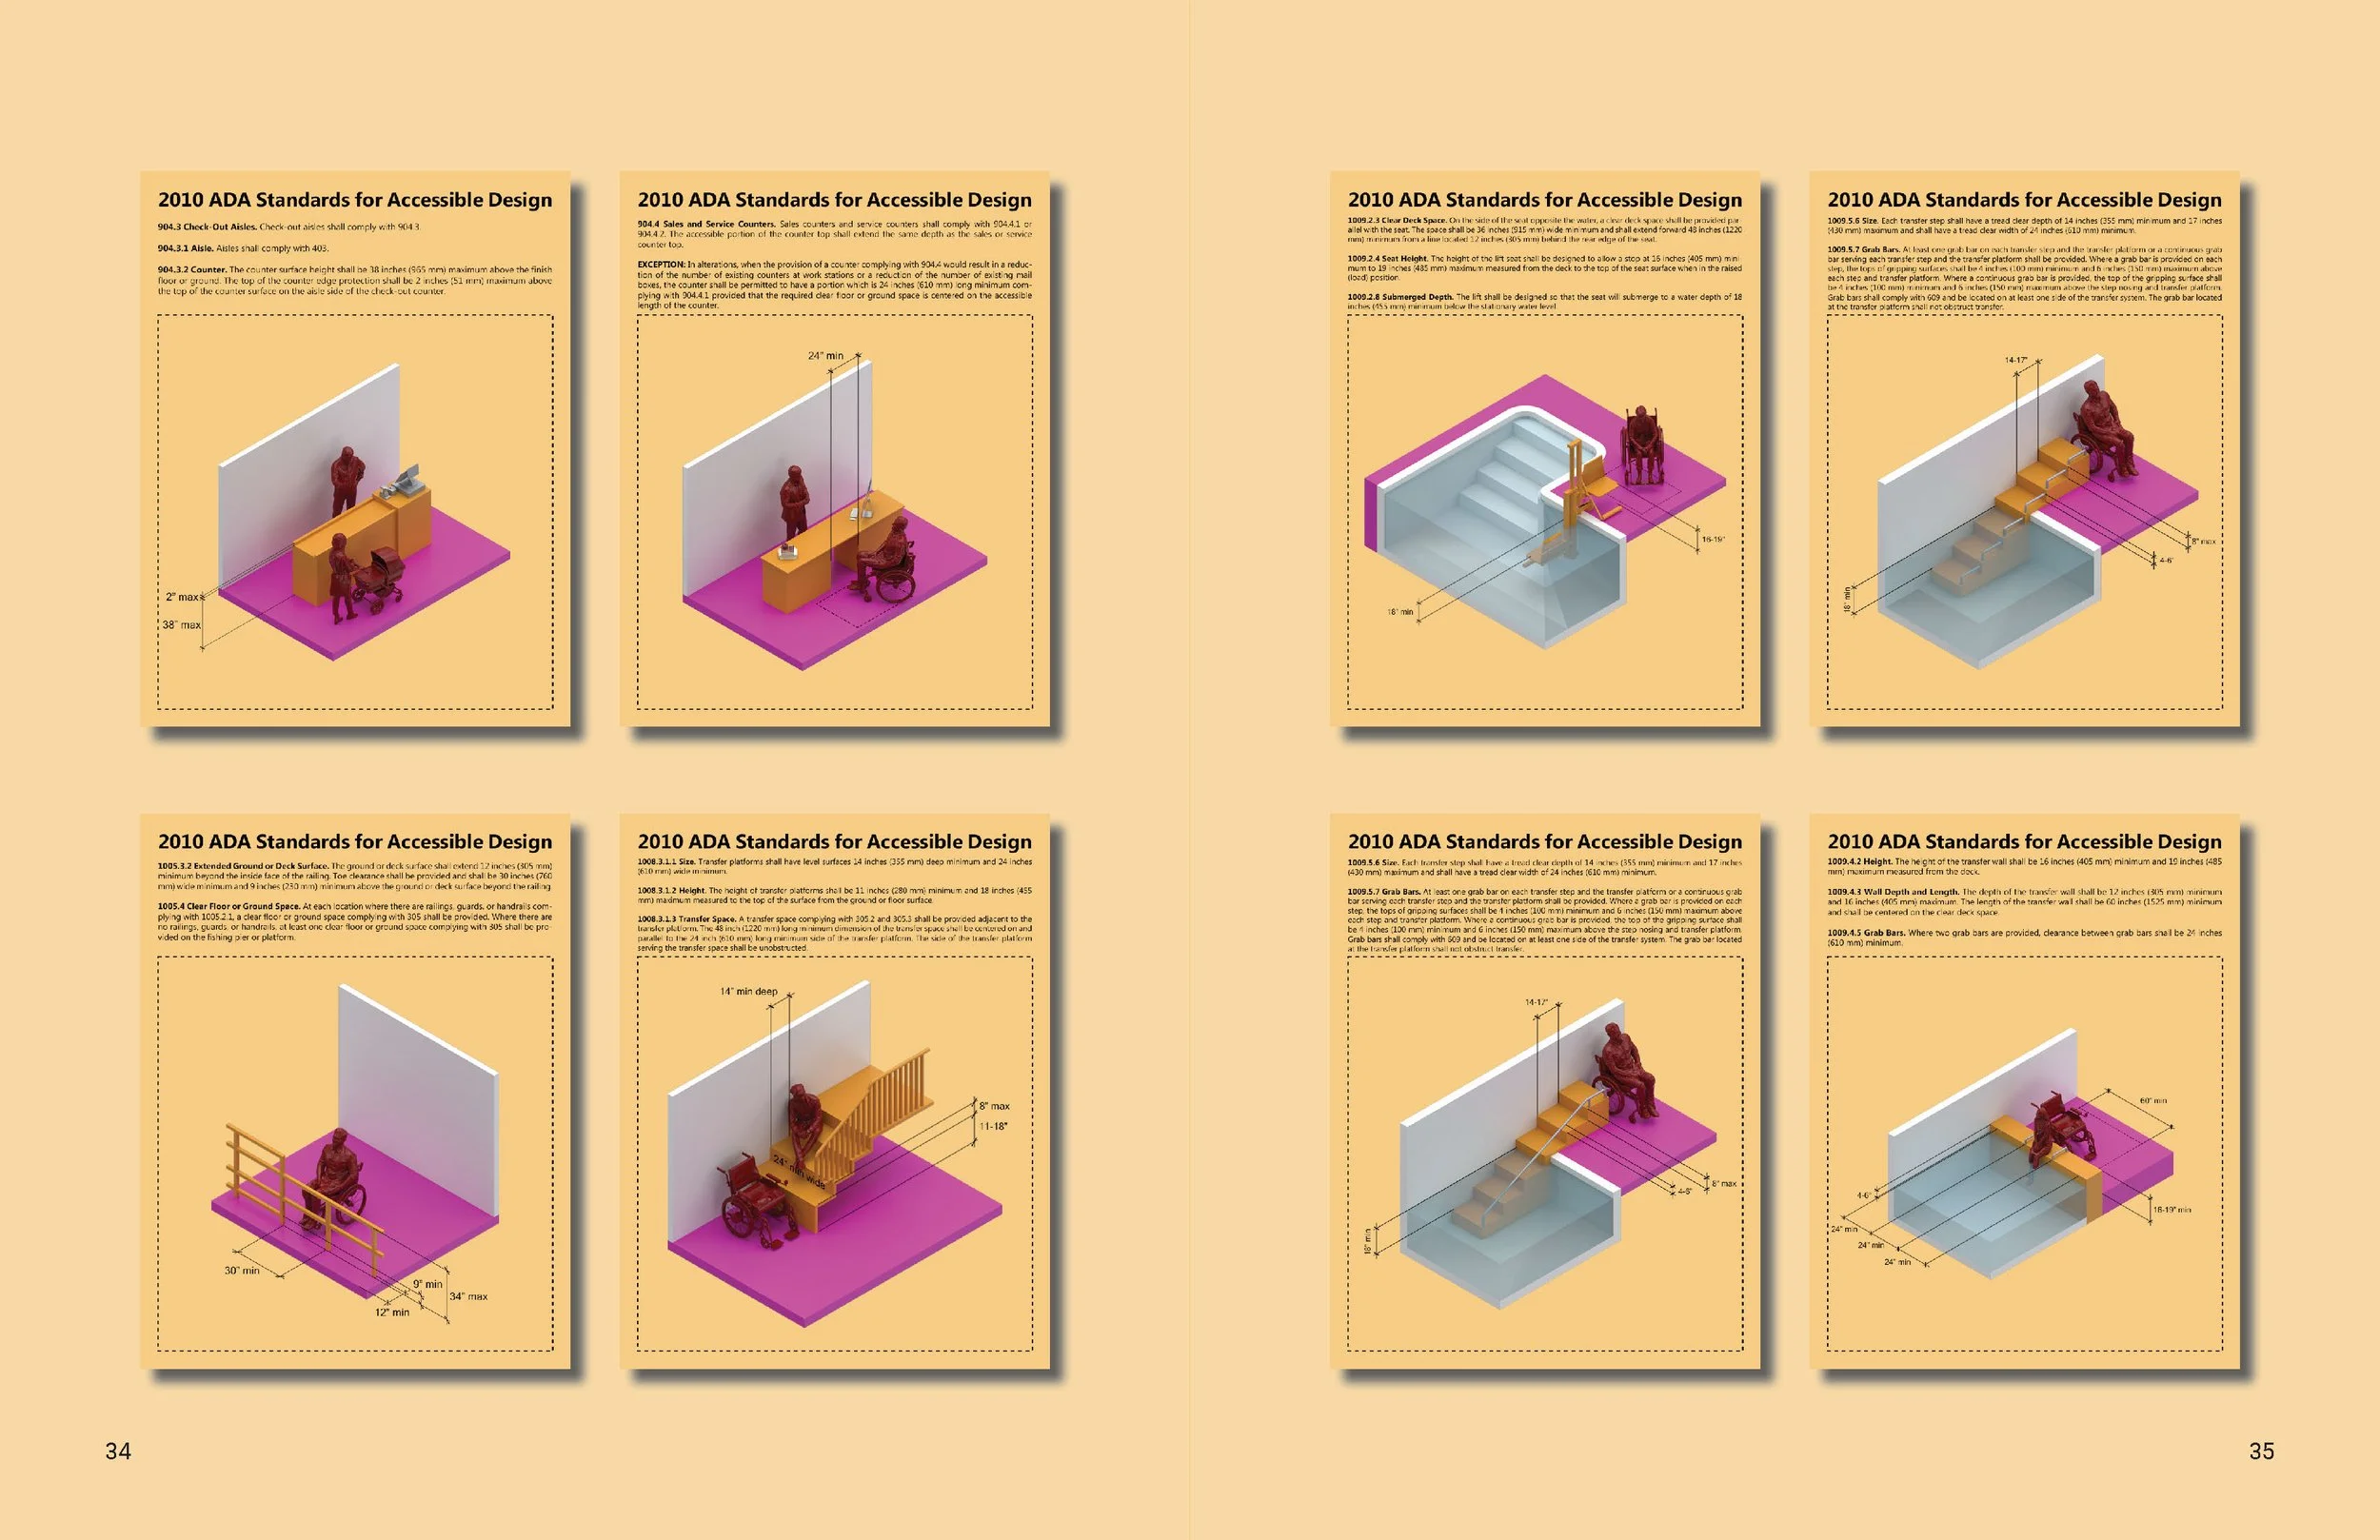
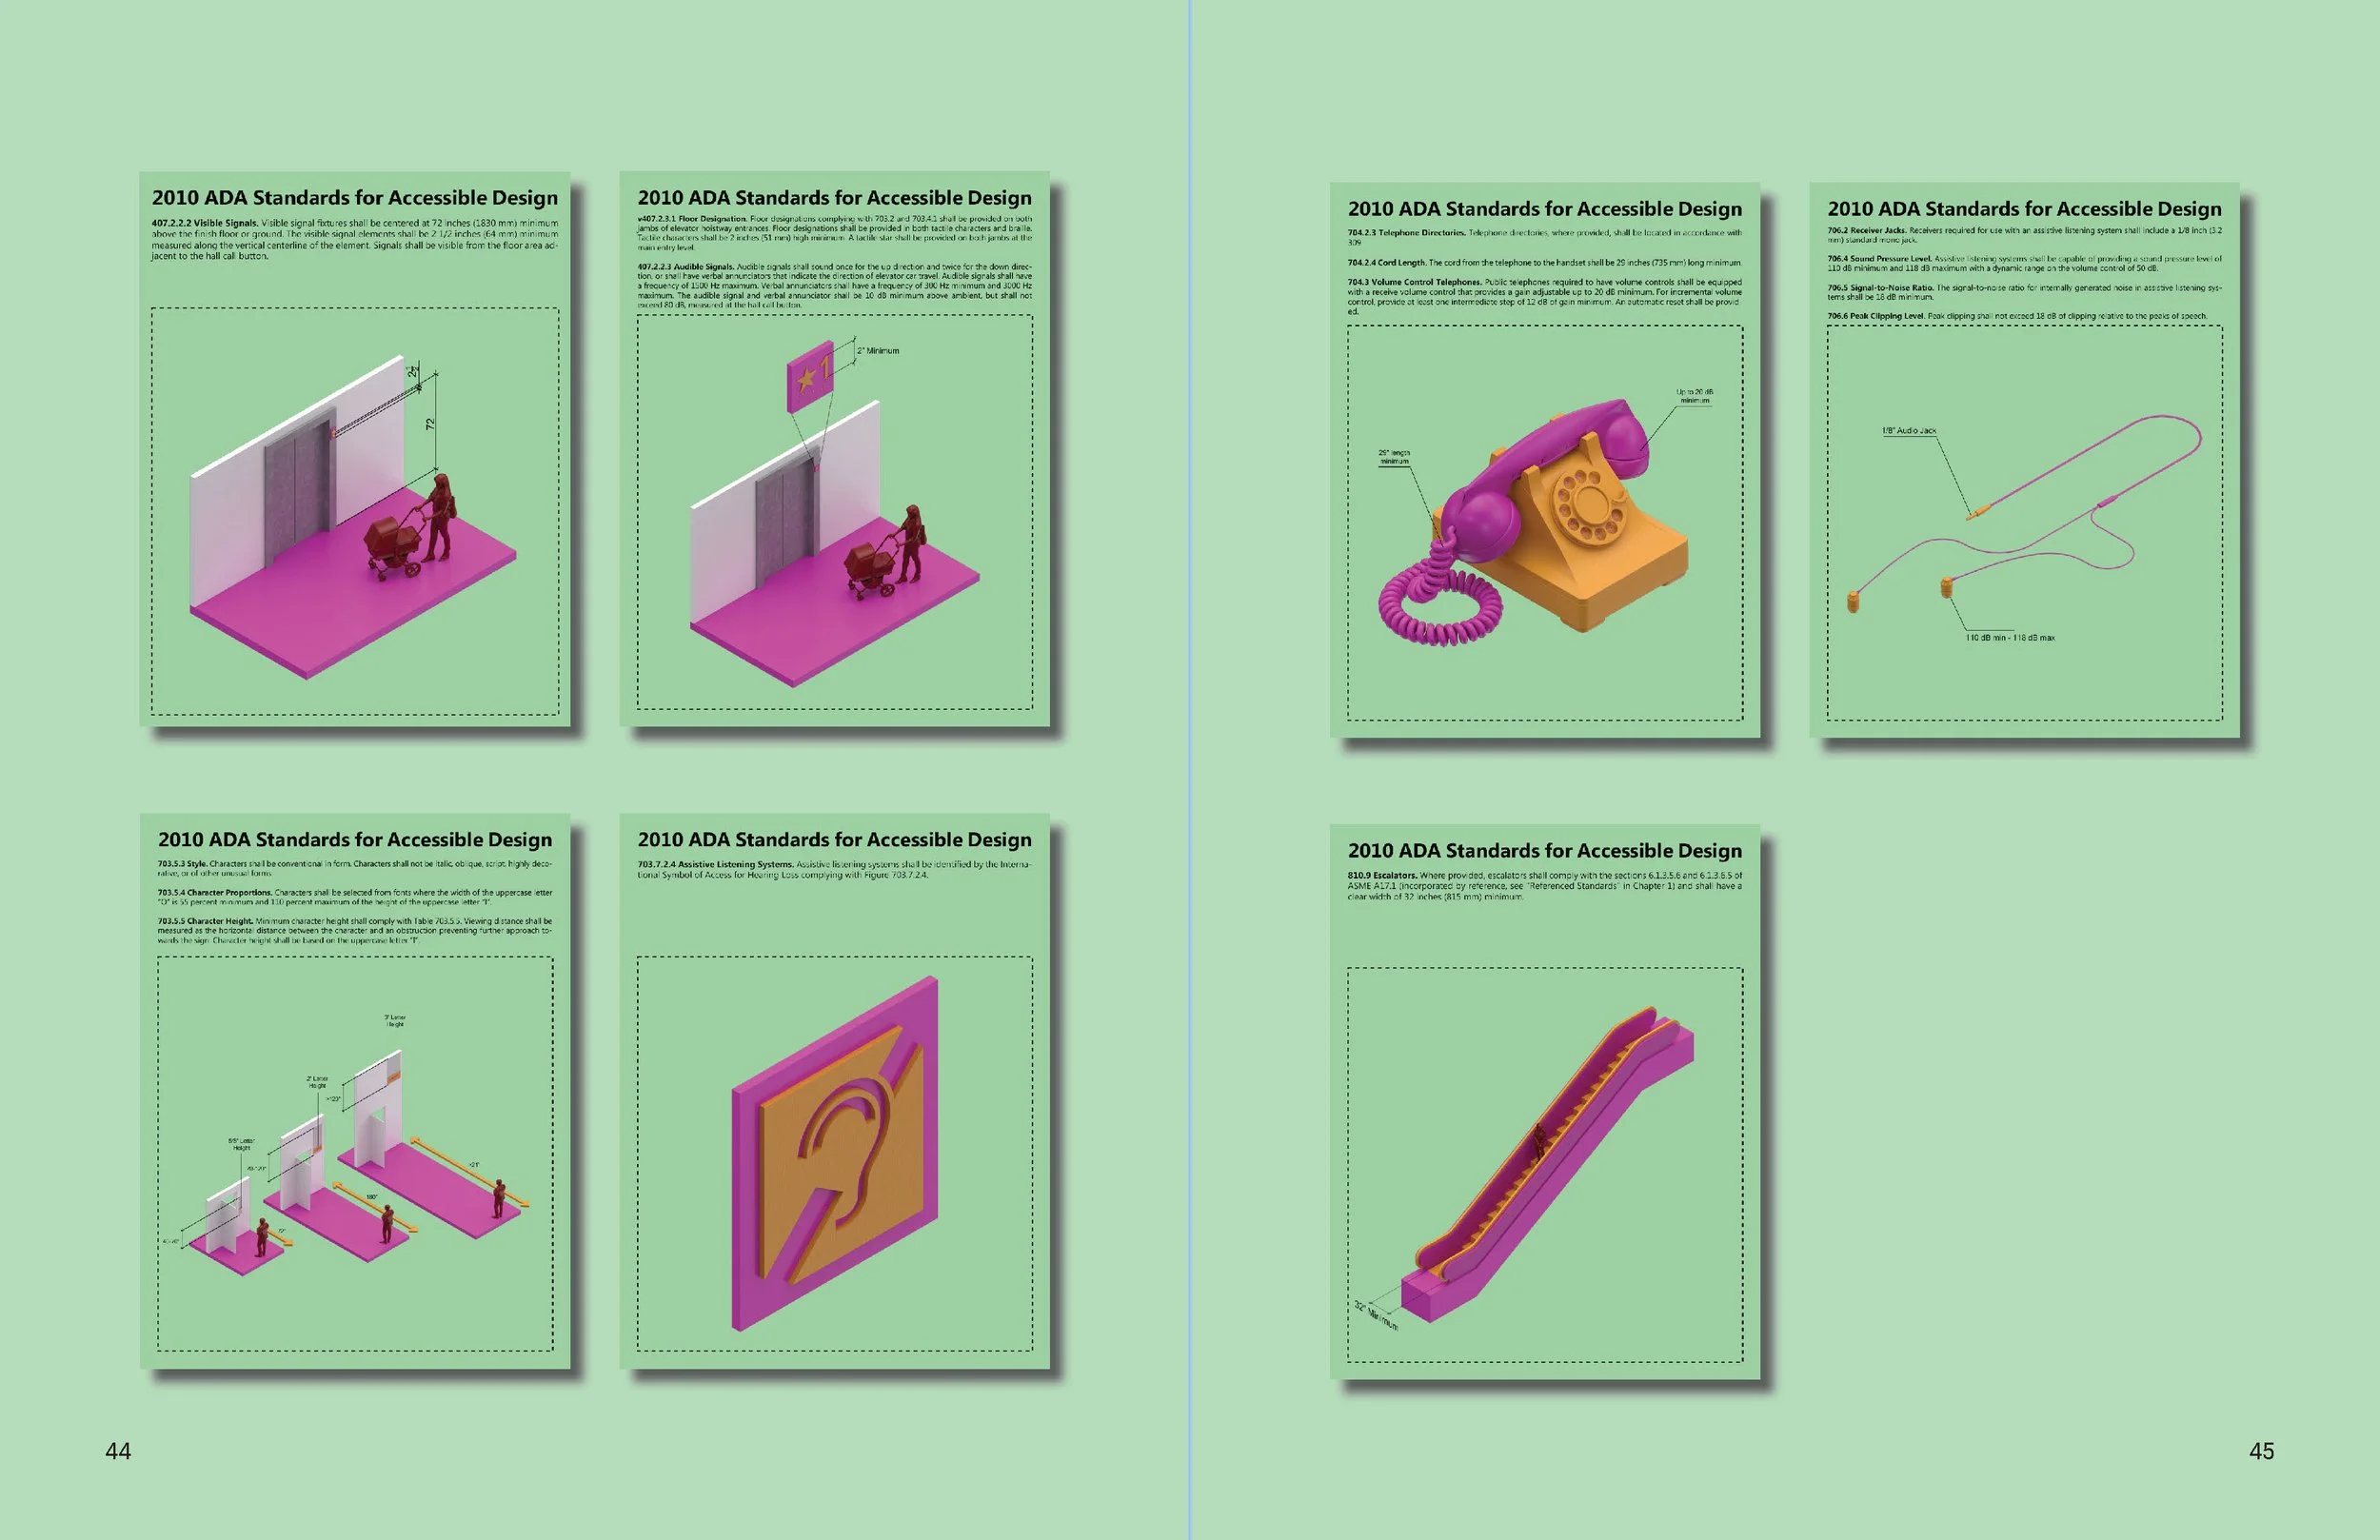
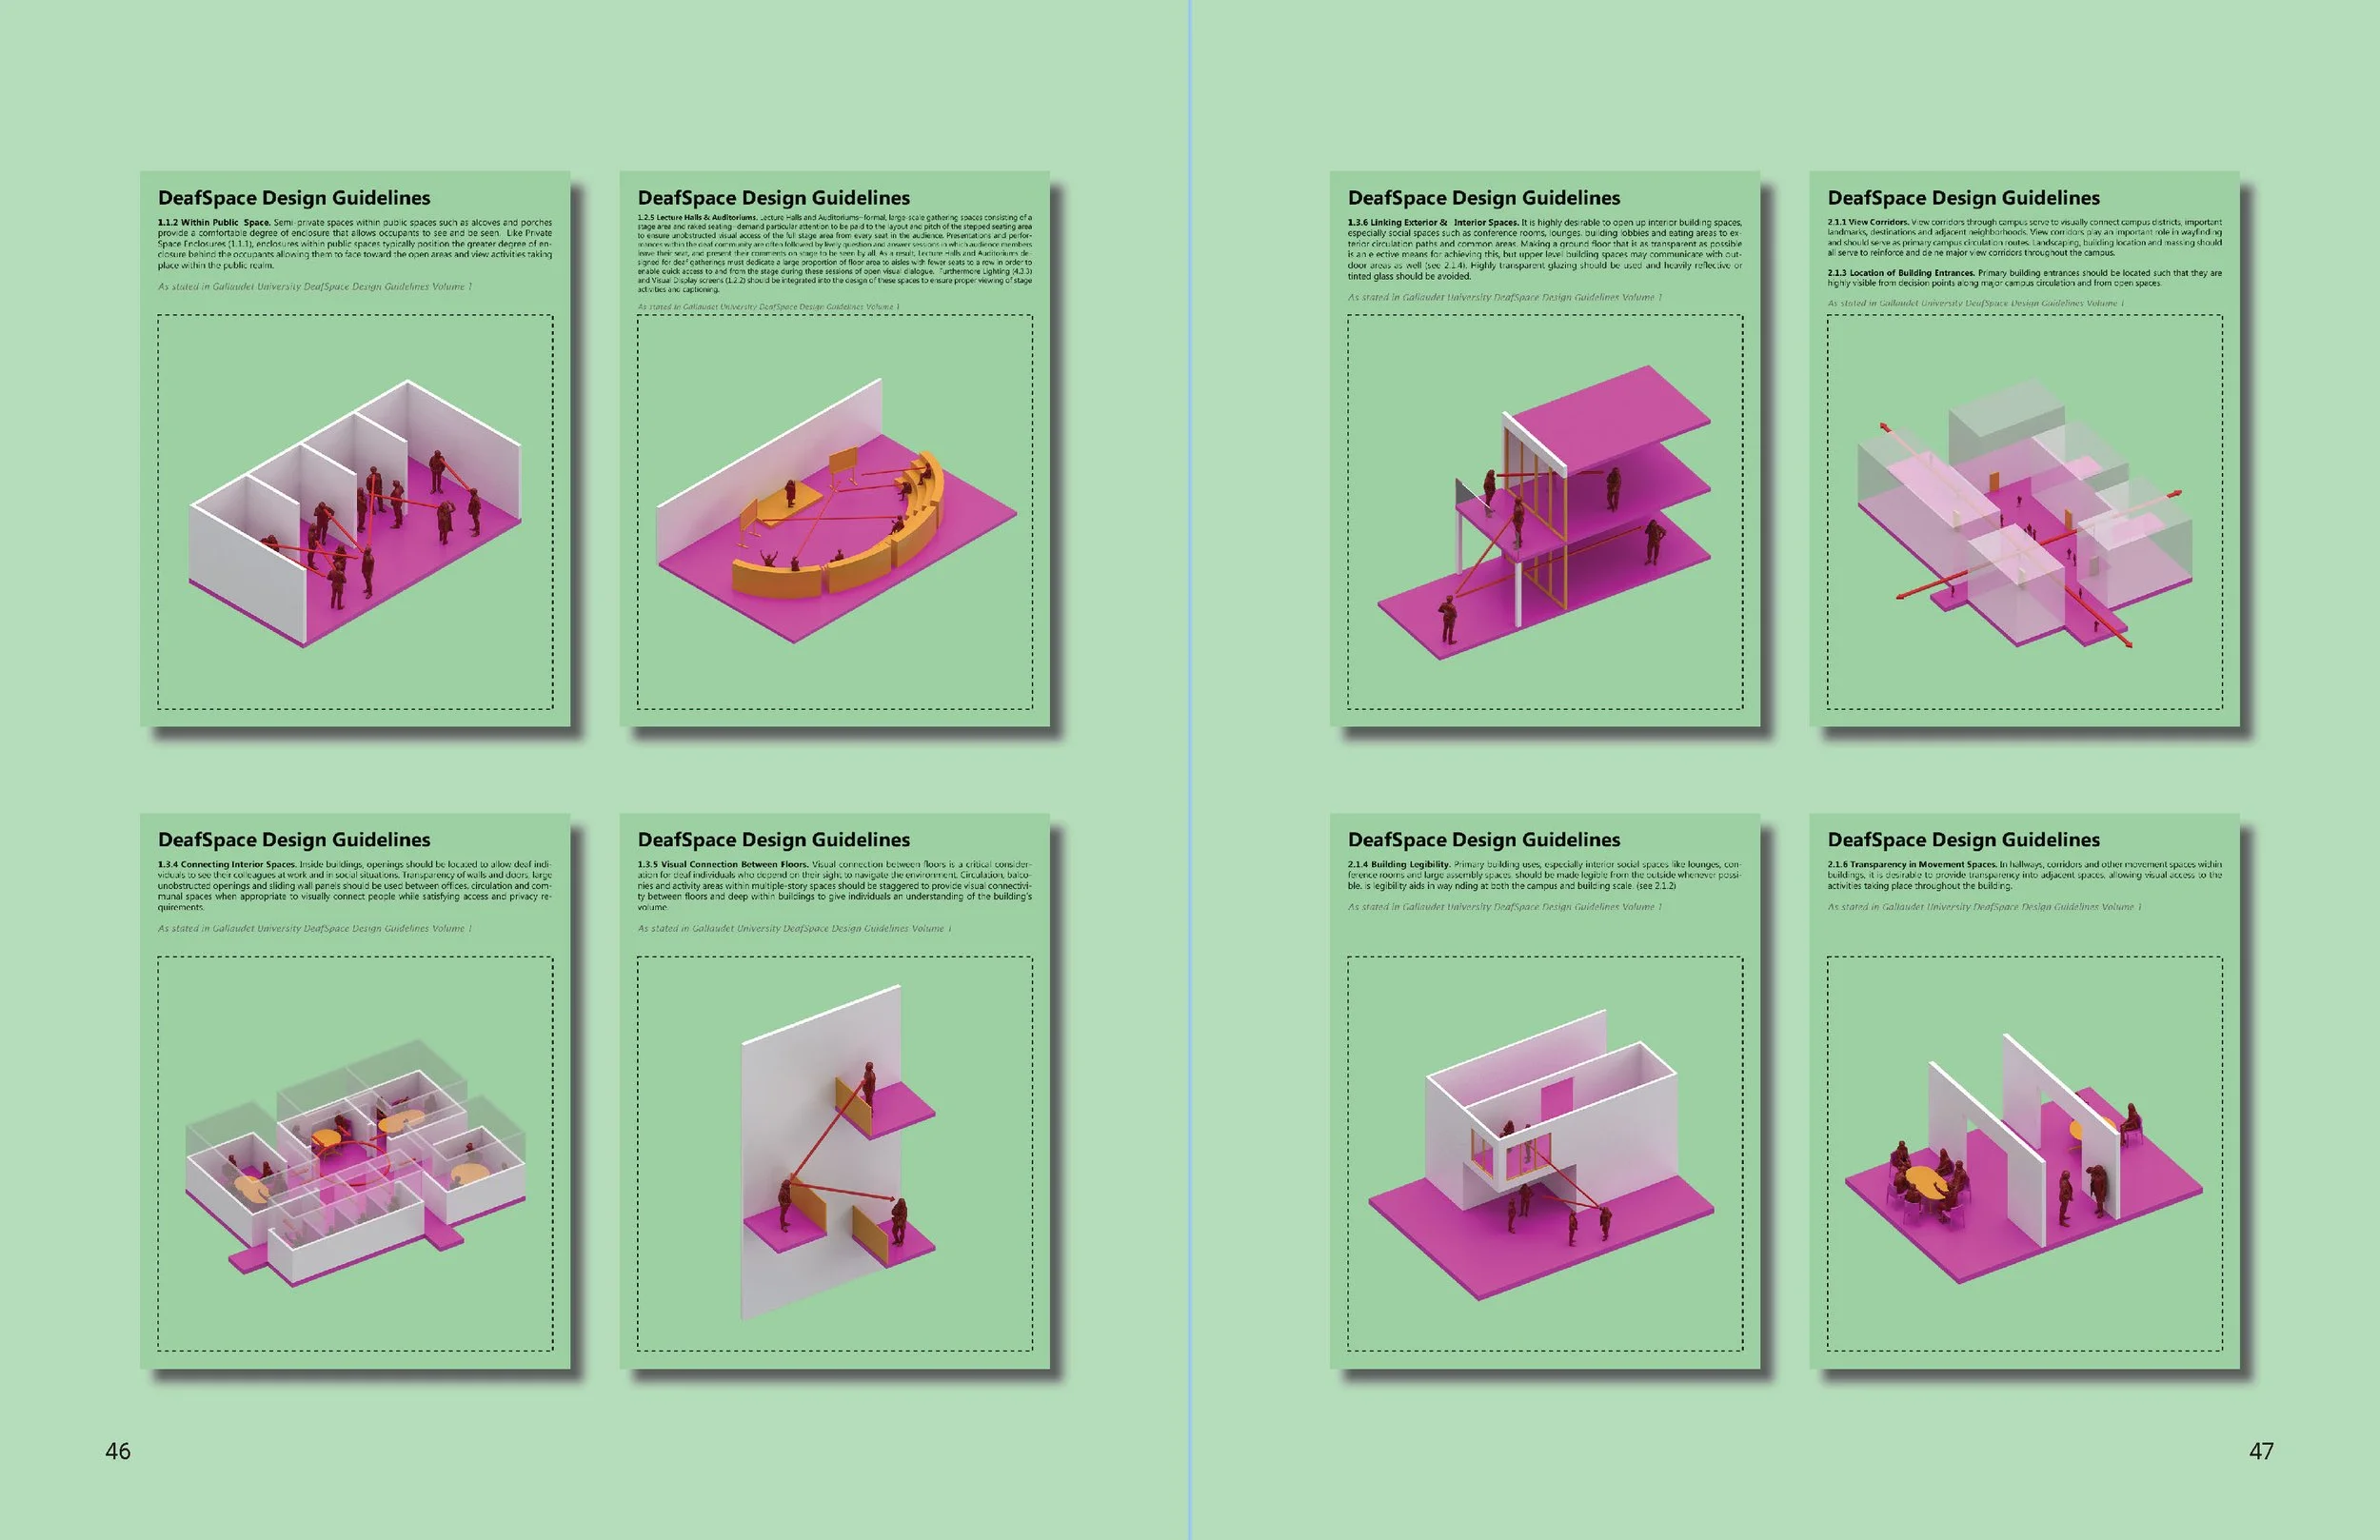
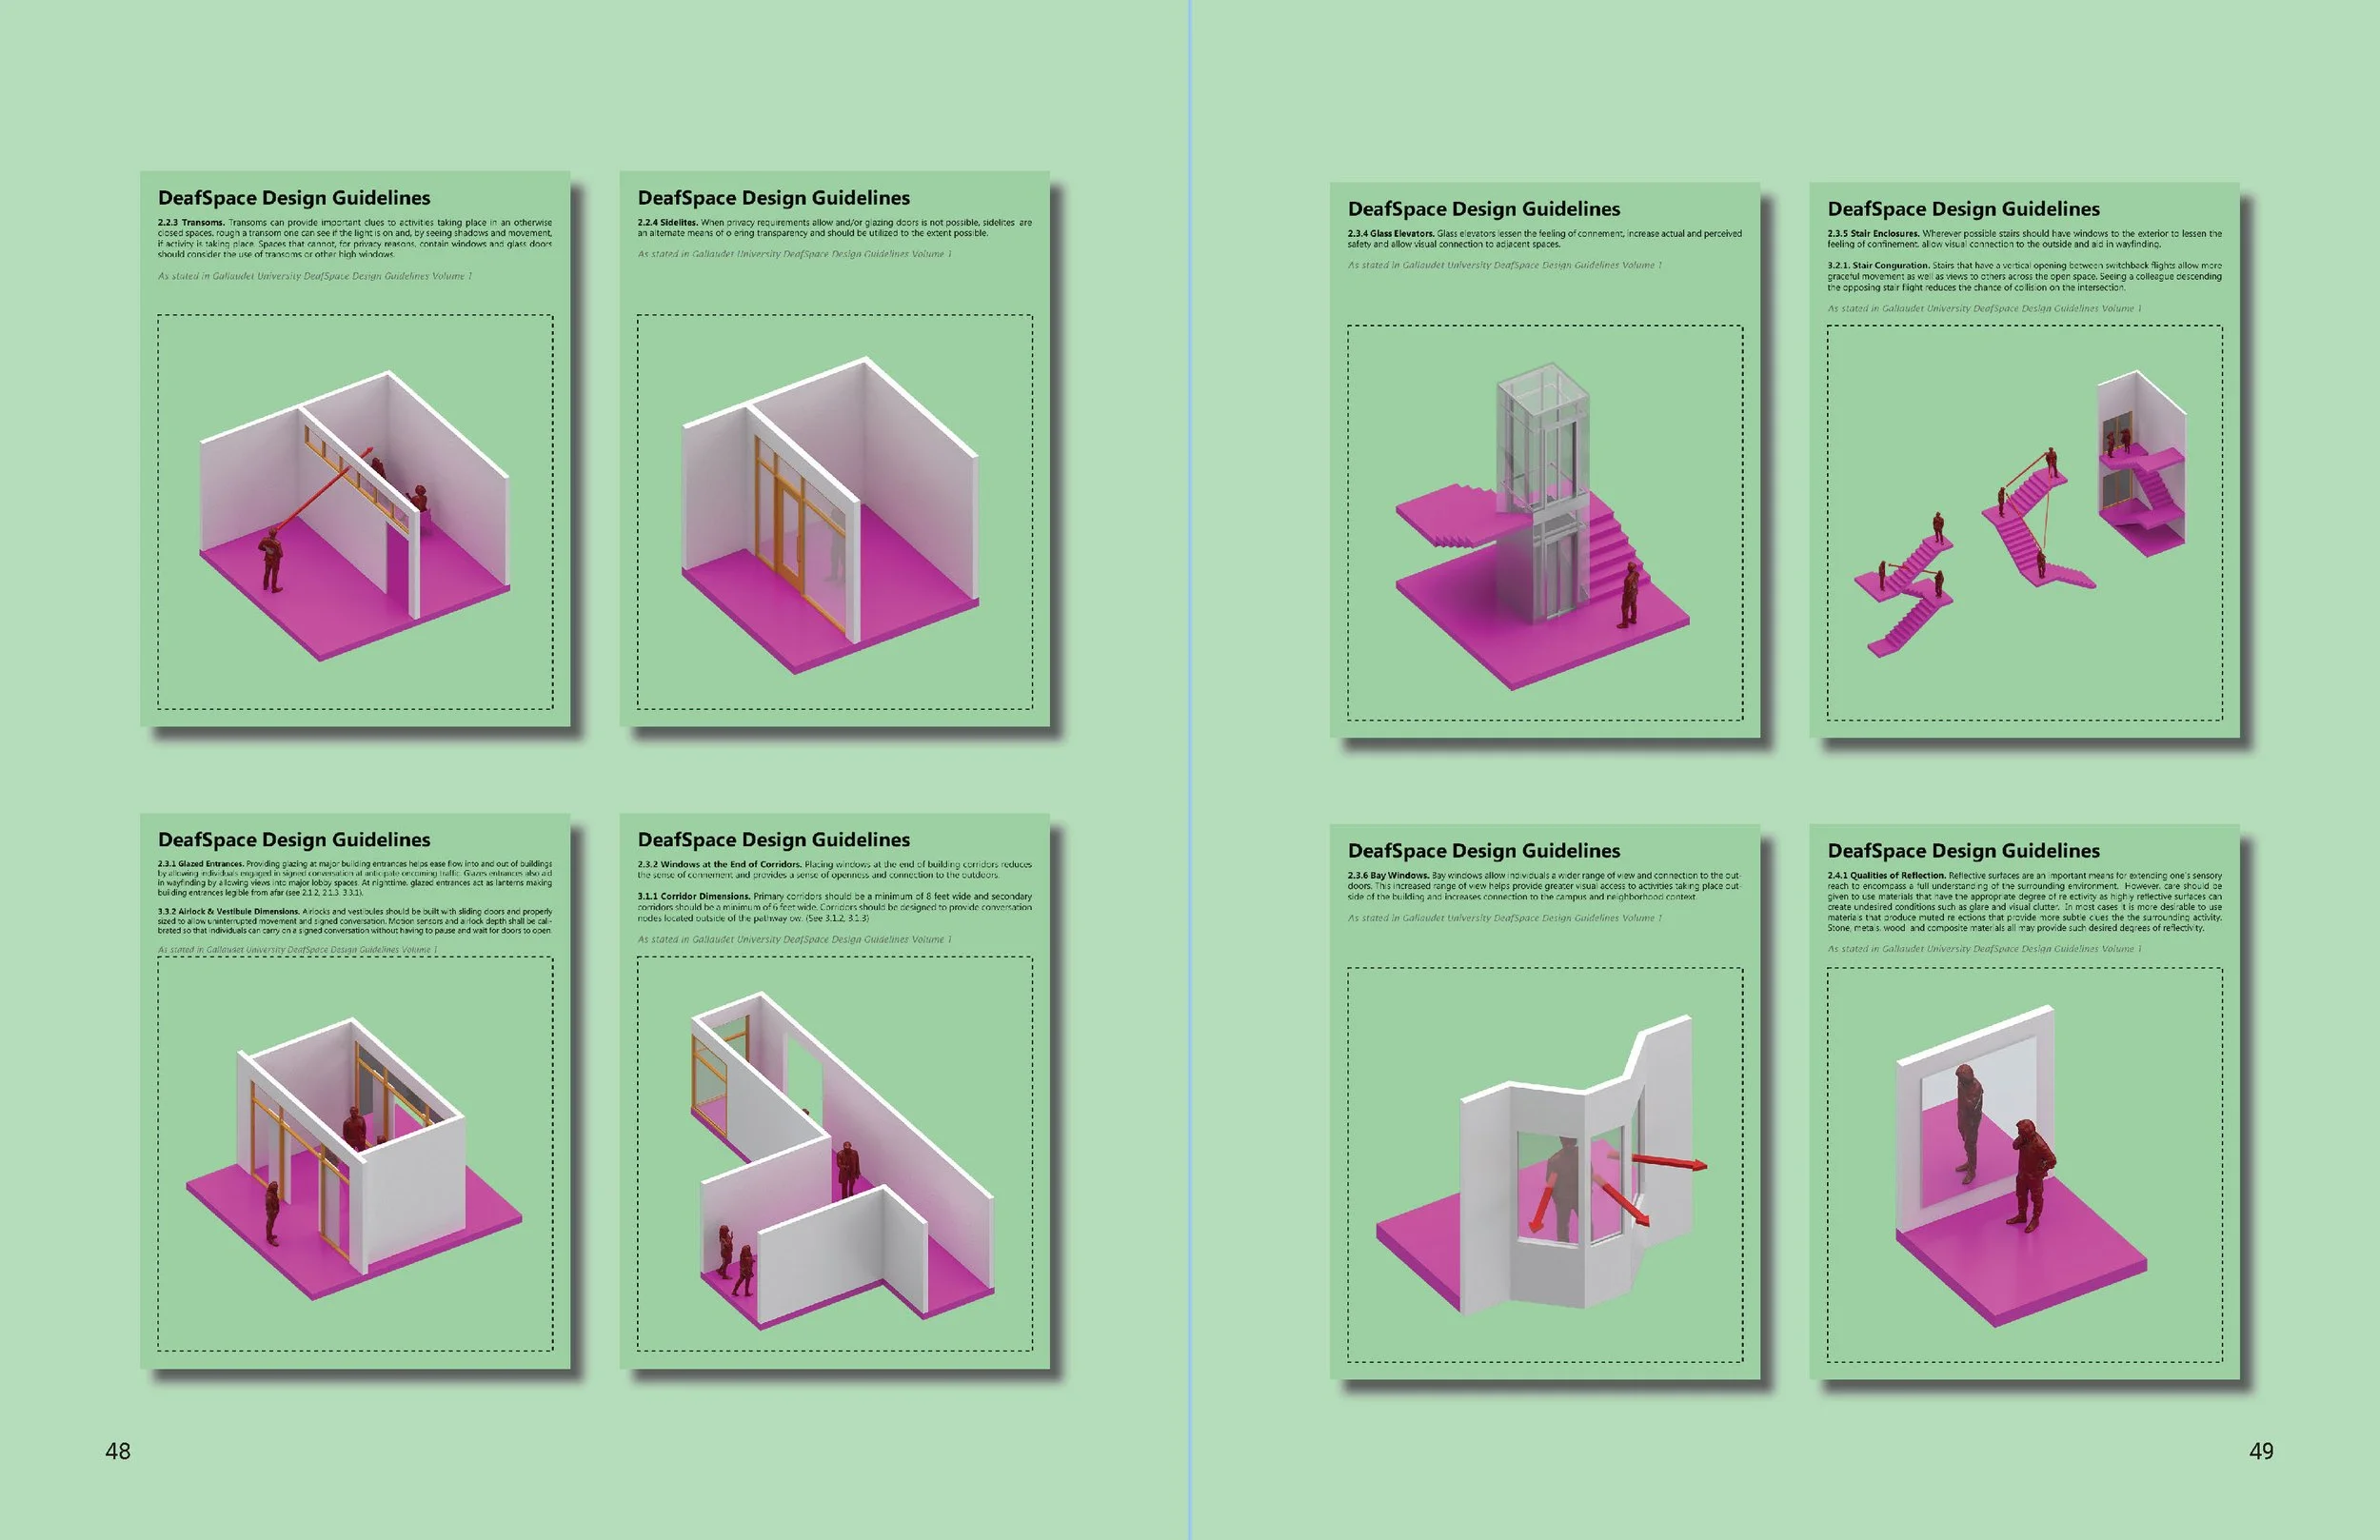
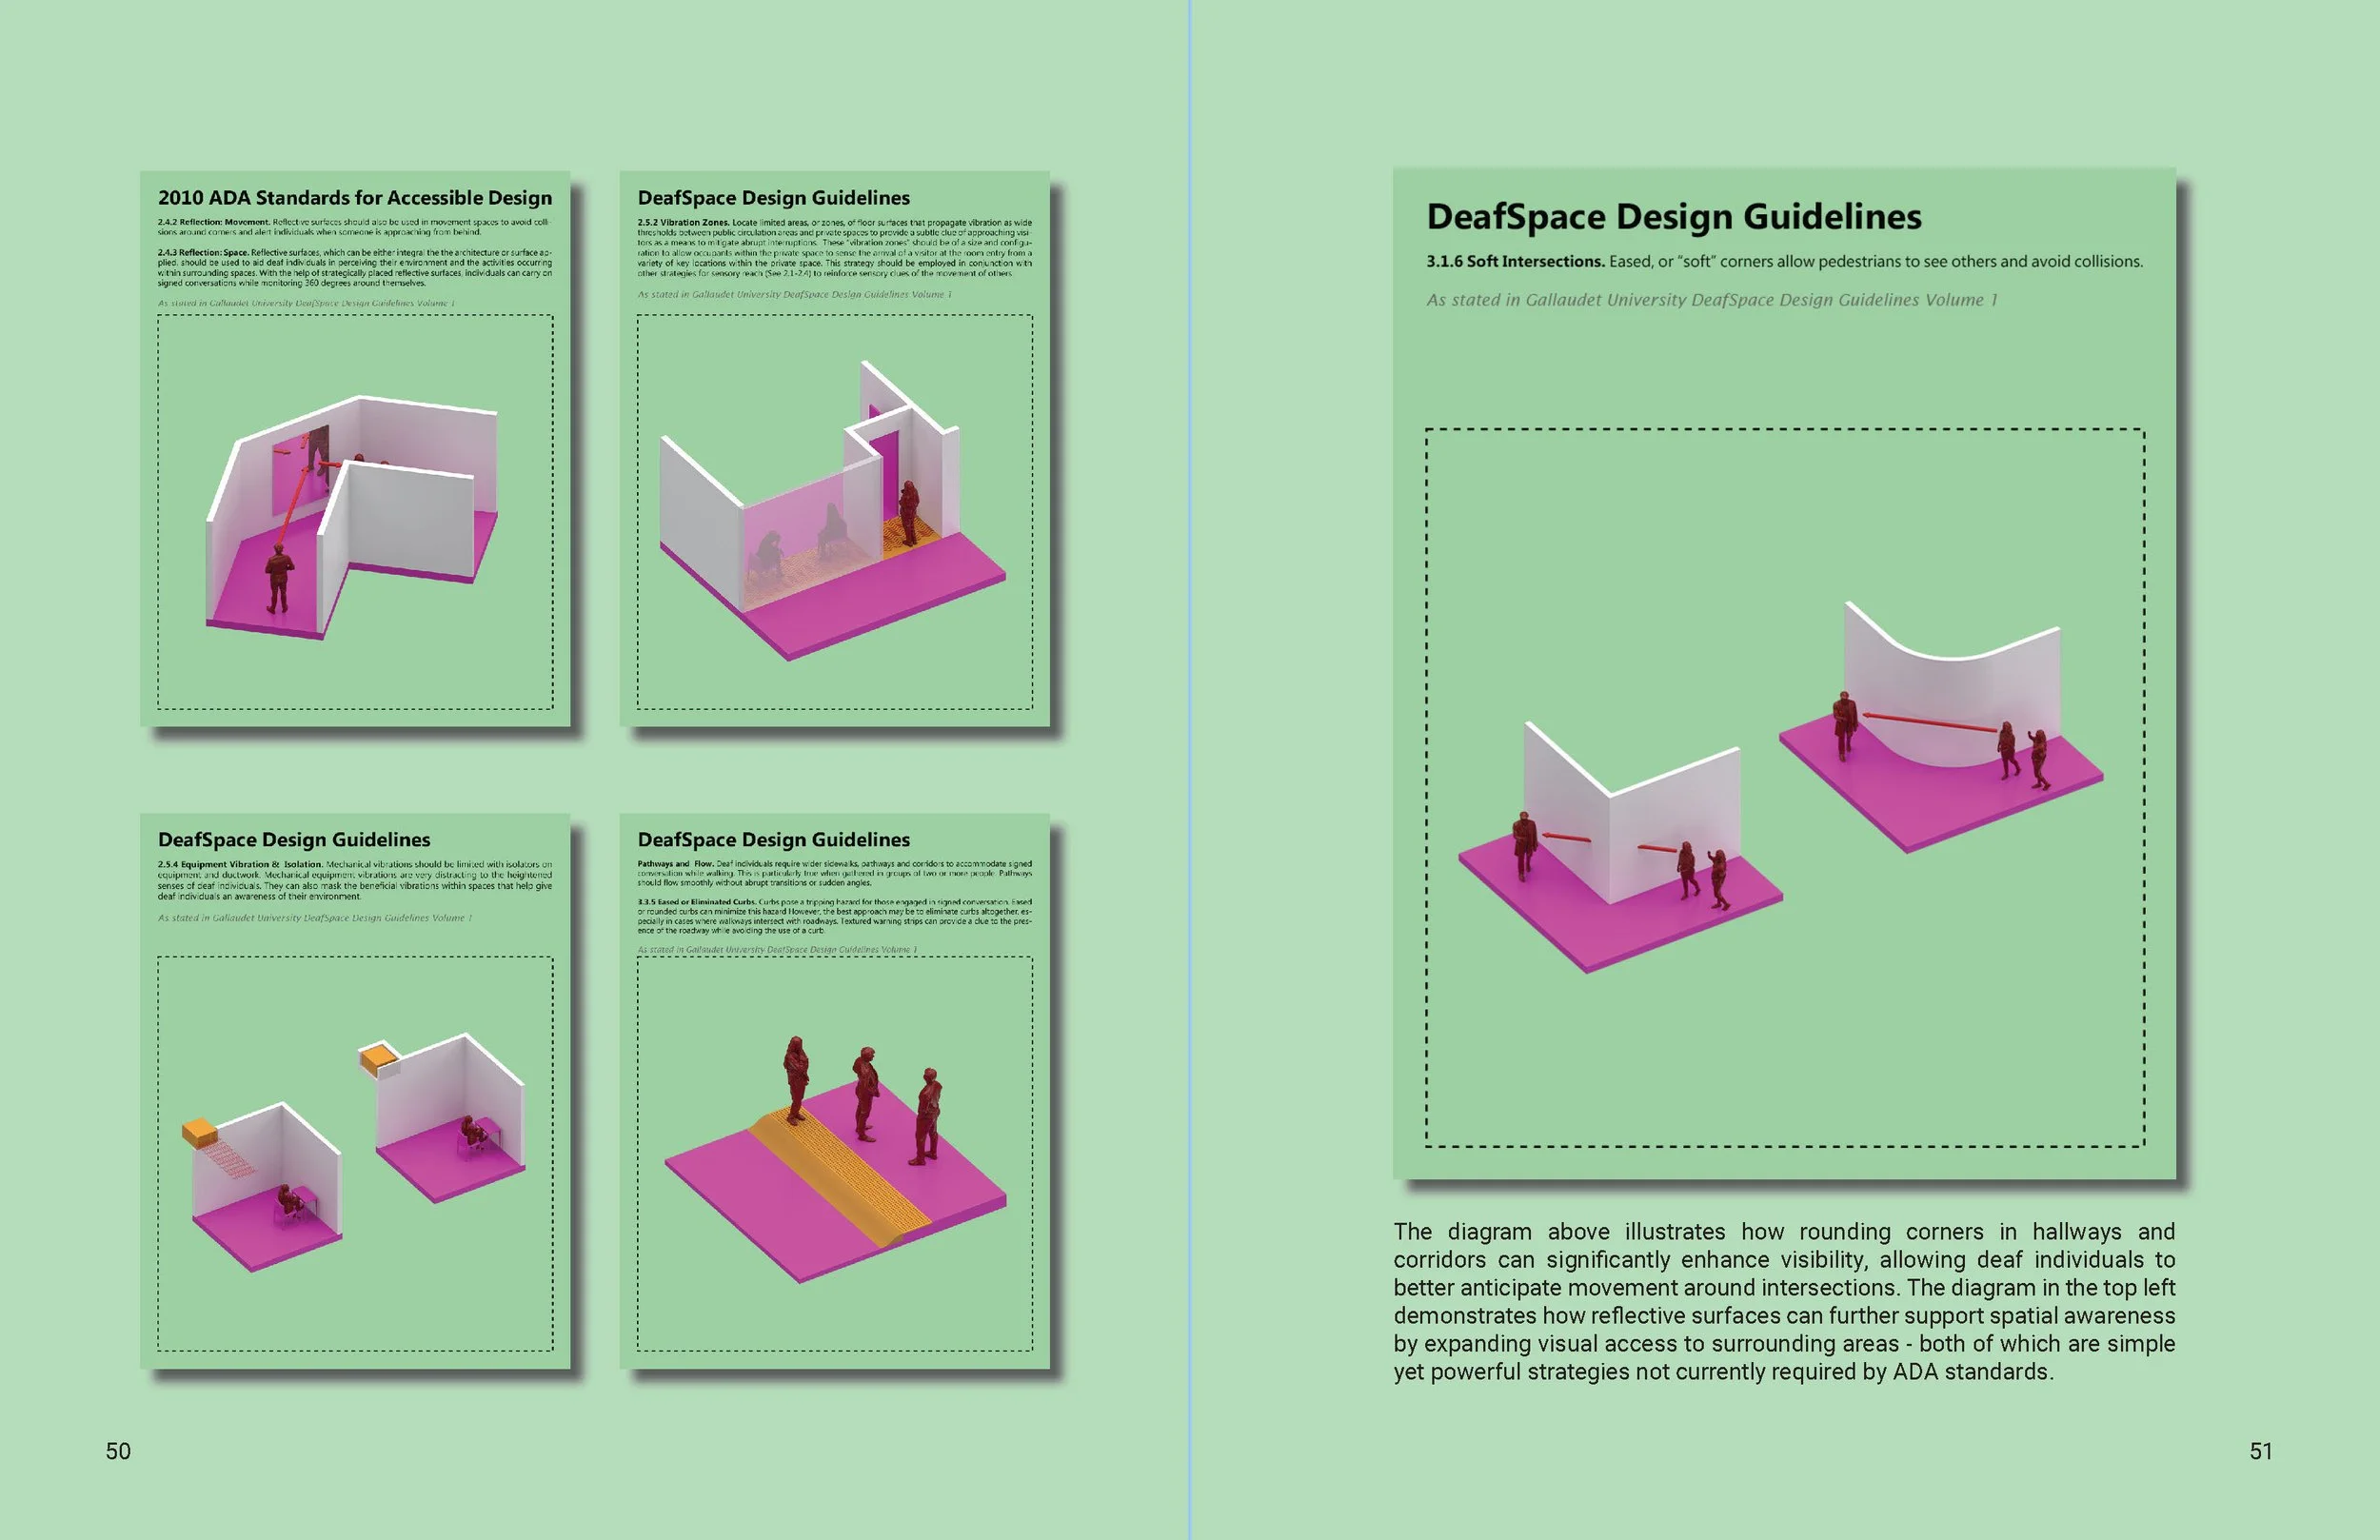
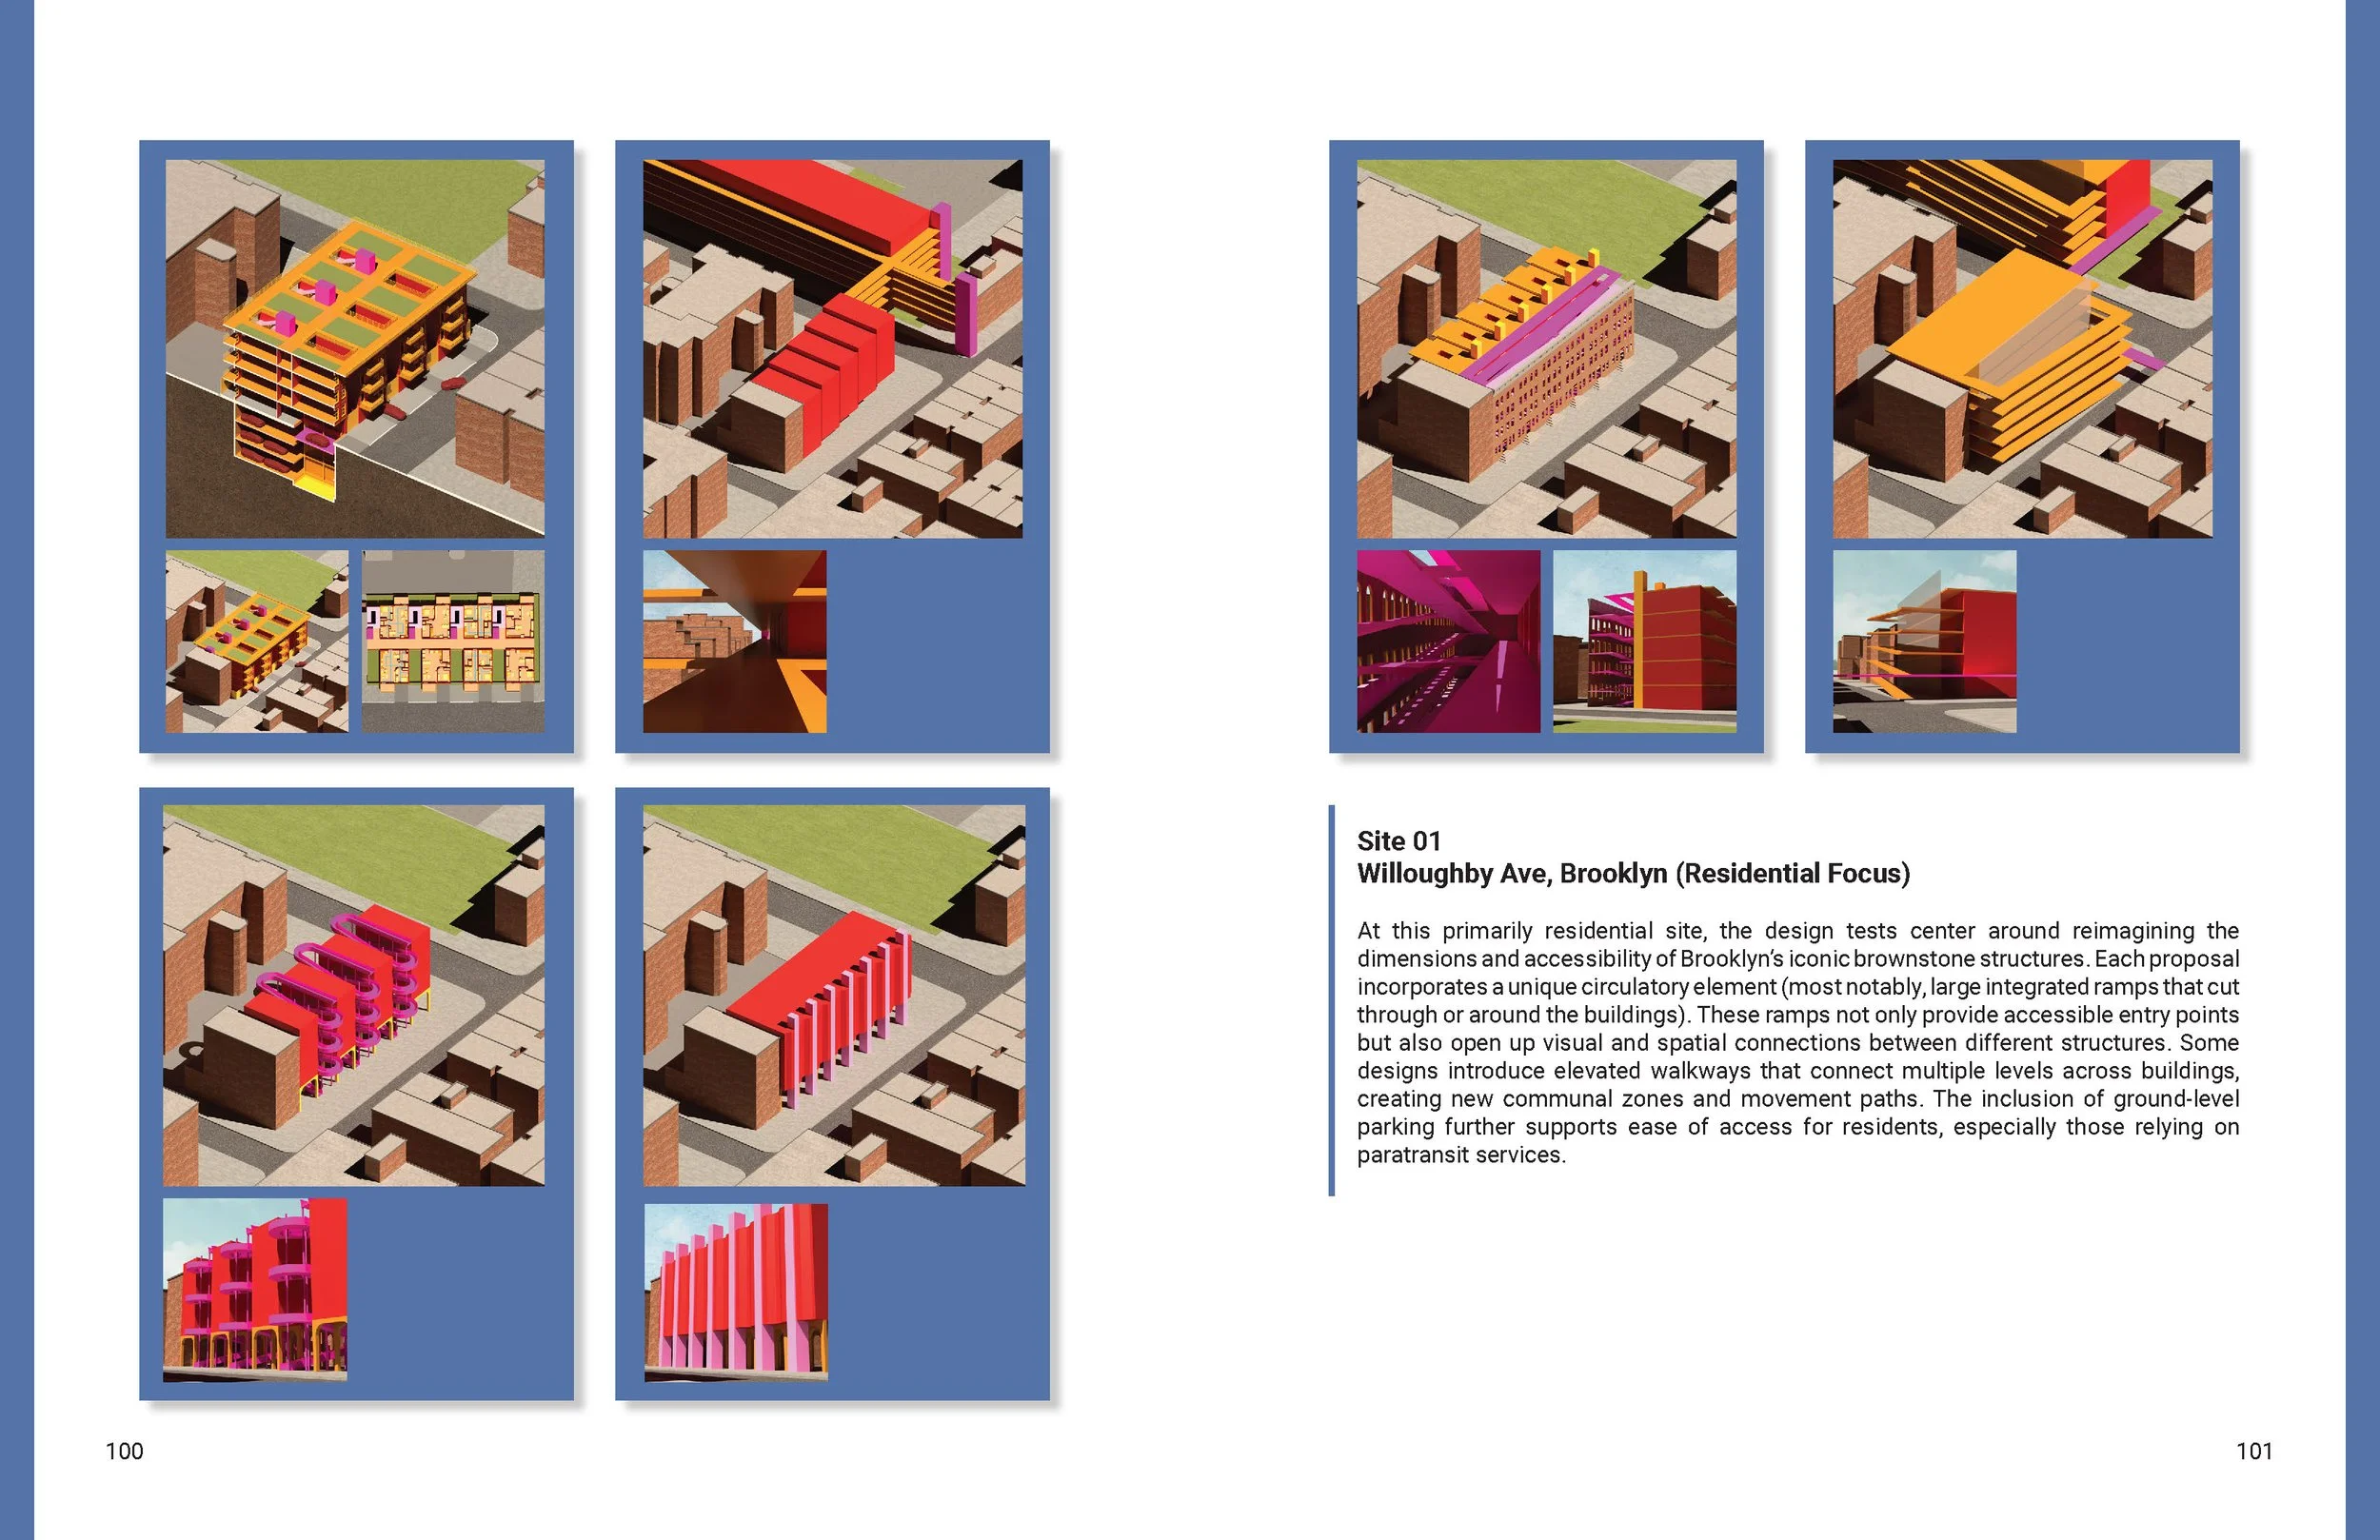
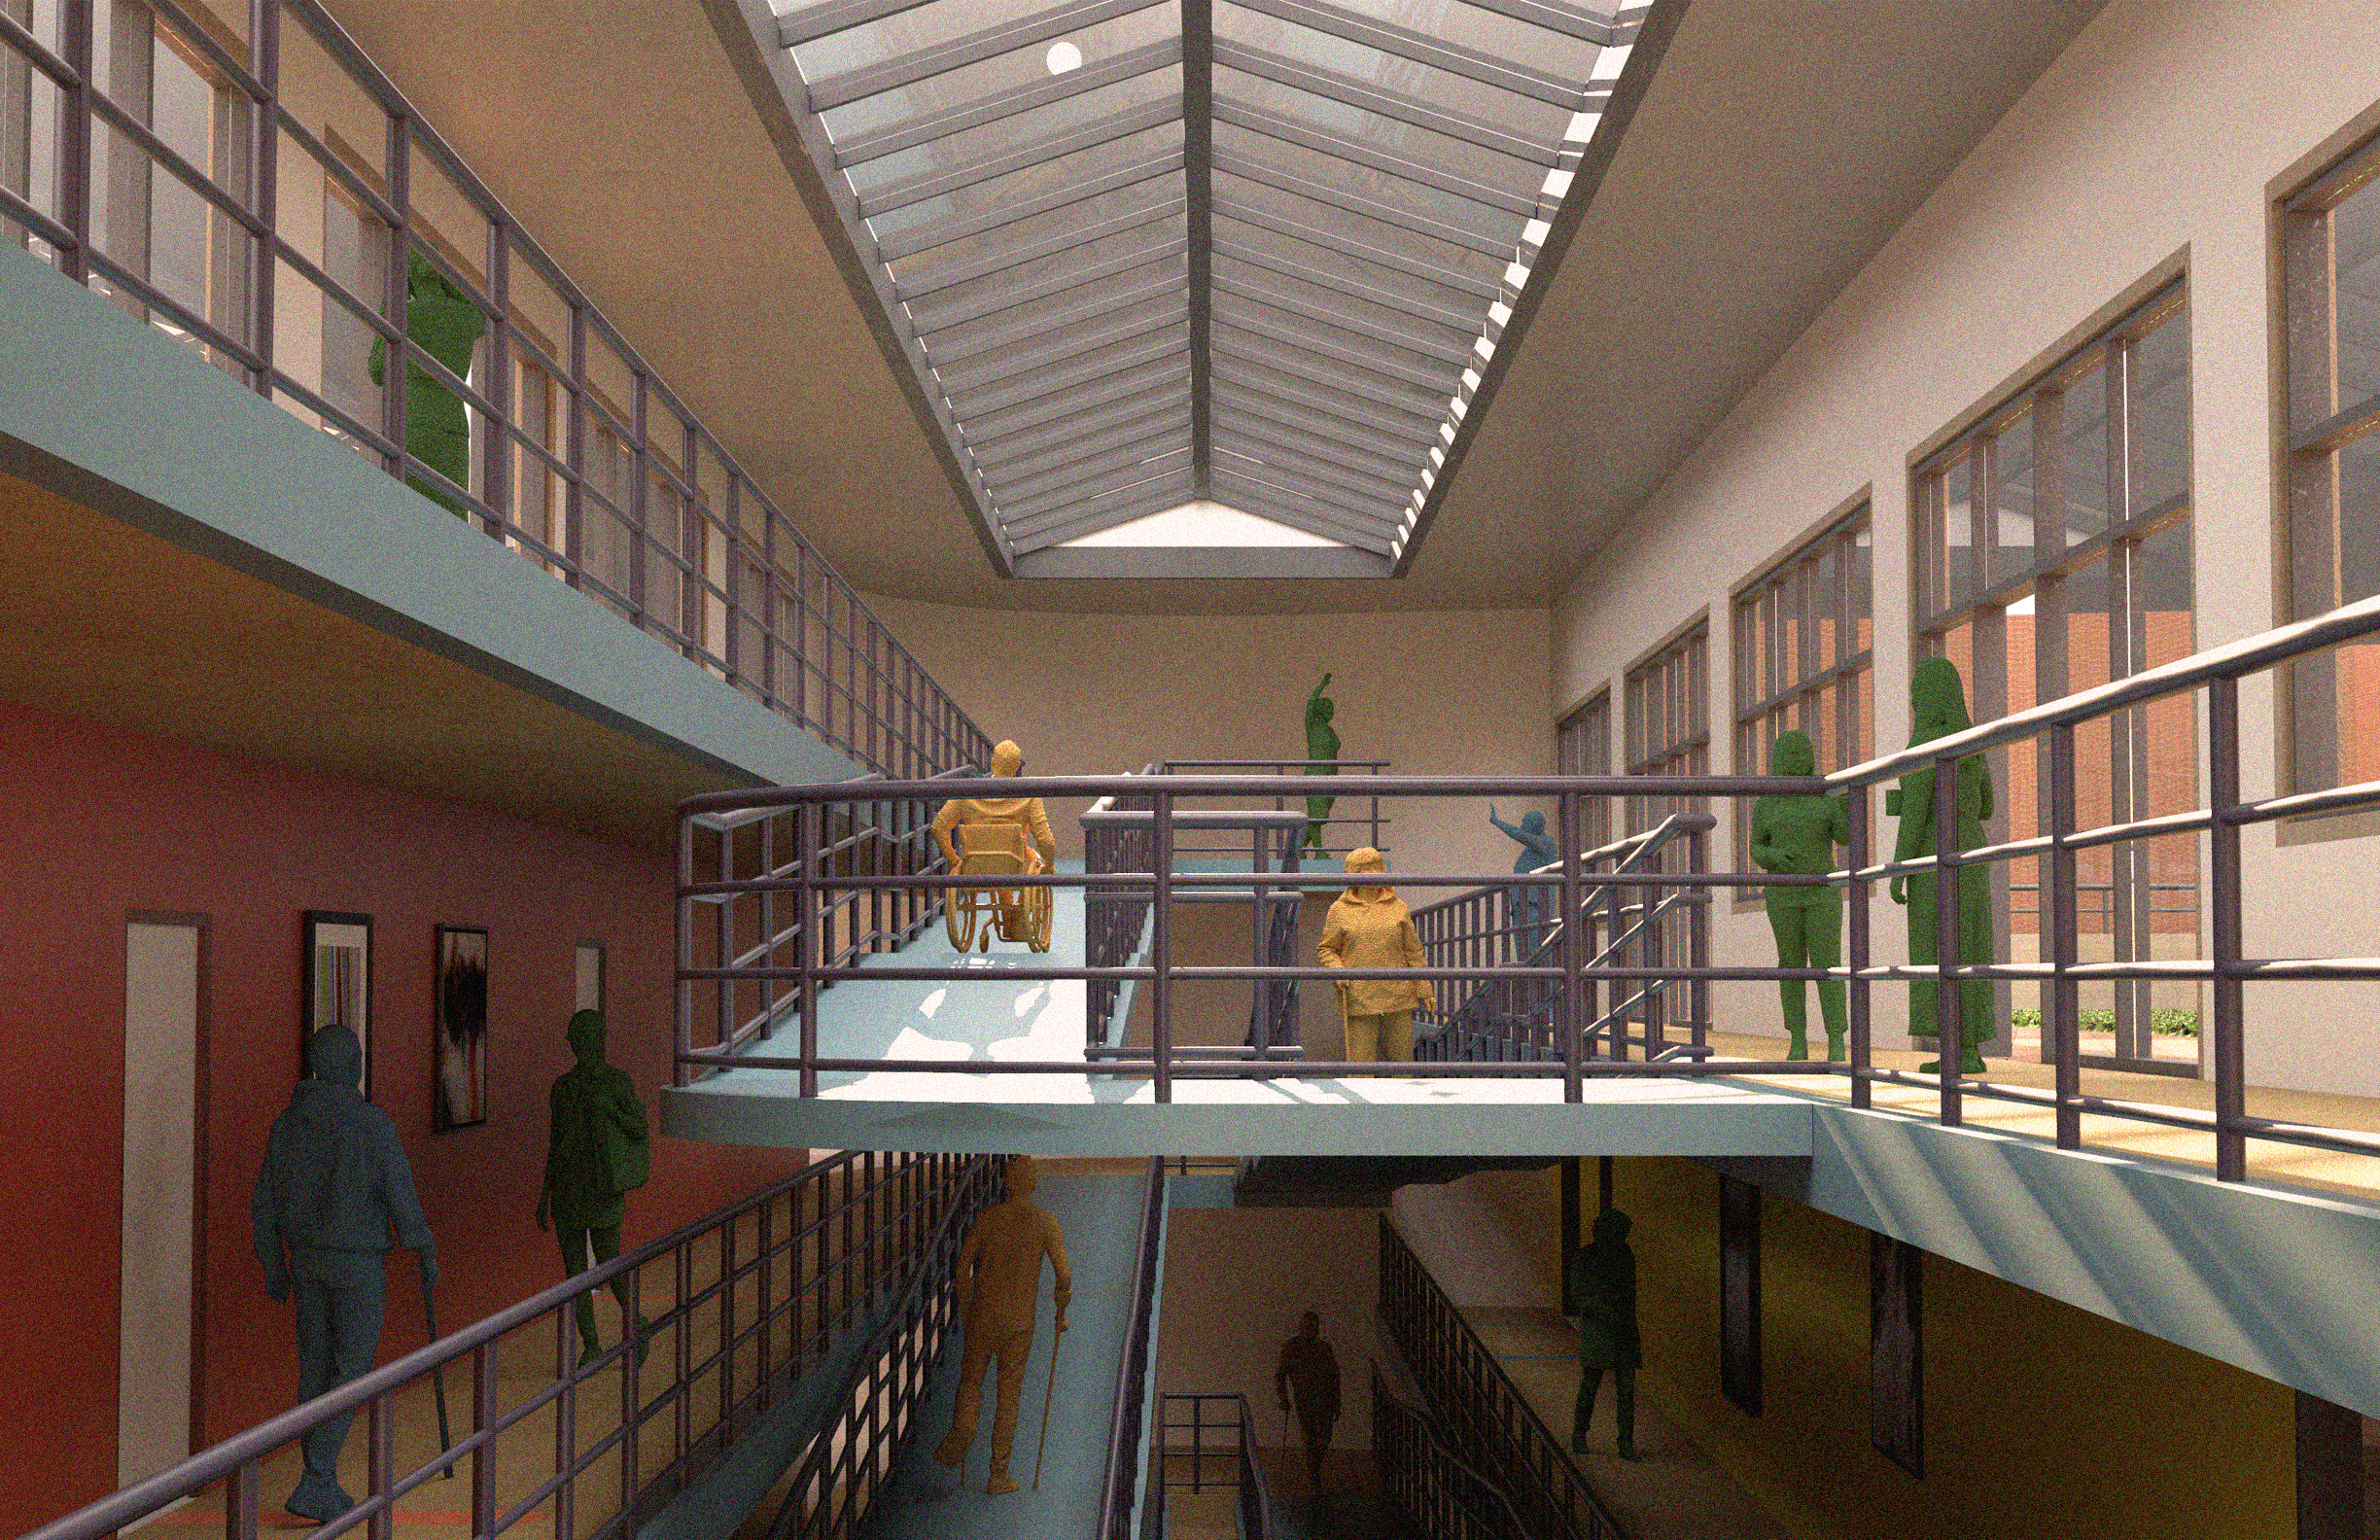
Architectural spaces should not be exclusive. All spaces should be functional, aesthetically pleasing, and, most importantly, accessible to all individuals, regardless of their physical or mental ability. Unfortunately, this is not the reality of our world today. While accessibility standards like the Americans with Disabilities Act (ADA), and other state or city specific legislation provide necessary regulations, they often set only the bare minimum requirements. As a result, many architectural spaces fall short, overlooking the unique needs of specific disabled groups. Unfortunately, accessibility is too frequently treated as a checkbox or a regulatory obligation rather than an opportunity for meaningful and creative design.

Bridging the Gap ultimately calls for a shift in the way architects approach accessibility. In the absence of stronger legislation, it is our responsibility as designers to advocate for inclusive and empowering environments that are welcoming to all. This thesis serves as both a critique of current practices and a roadmap for integrating accessibility more meaningfully into design. In the end, no space should be restrictive—every design offers an opportunity to create a space that is truly accessible and enriching for all individuals, regardless of their abilities.


RESEARCH FOUNDATIONS | ANALYZING EXISTING STANDARDS

At the beginning of this thesis journey, it was important to ground the speculative design approach in a thorough understanding of current accessibility standards and practices. This research was not just about uncovering what exists, but critically examining how existing regulations support (or fail to support) the diverse and nuanced needs of disabled individuals. To help guide this analysis, this thesis focused on the lived experiences and spatial needs of three key user groups: wheelchair users, individuals who are visually impaired, and members of the deaf and hard-of-hearing community.

These three groups were chosen because their accessibility needs span a wide spectrum - ranging from mobility limitations, to sensory issues, and a lack of communicative engagement. Additionally, the design challenges these groups face in the built environment are both varied and deeply revealing of the architectural profession’s prevailing blind spots. By anchoring the research in their distinct experiences, it became possible to not only evaluate accessibility guidelines in a more directed/focused way, but also to begin reimagining how those guidelines could be pushed beyond compliance to achieve true inclusivity and design innovation.

WHEELCHAIR USERS | NAVIGATING PHYSICAL BARRIERS

The first lens of this research focused on the needs of wheelchair users, whose spatial experience is often dictated by the physical features of a building. The Americans with Disabilities Act (ADA) provides a robust set of regulations regarding minimum clearances, ramp slopes, doorway widths, and bathroom dimensions. However, when studied critically, these standards often reveal themselves to be just that - minimums. While the ADA ensures basic functionality and access, it rarely supports ease of movement or comfort, and it almost never prioritizes spatial dignity or aesthetic integration.

In examining the ADA through the lens of a wheelchair user, several questions arose: Does a ramp merely provide a way into a building, or can it be an integral design feature? Are accessible restrooms simply spaces that meet code, or can they be uplifting and empowering environments? By asking these questions, the research began to highlight the tension between compliance and design quality—a tension that this thesis seeks to resolve through speculative and creative exploration.

THE VISUALLY IMPAIRED | RELYING ON NON-VISUAL CUES

The second lens focused on the visually impaired community, whose relationship to architecture is often mediated through tactile, auditory, and spatial cues. The ADA does include some provisions for this group - such as requirements for Braille signage, audible alerts in elevators, and tactile warnings at curb ramps - but these elements are often applied in a formulaic, afterthought manner. Rarely do they contribute to the design language of a space.

Through this research, it became clear that the current guidelines fall short in addressing the dynamic, sensory-rich environments needed by those who rely on alternative modes of navigation. What if tactile surfaces were not just inserts, but part of the floor pattern itself? What if soundscapes were designed as intentional architectural features, rather than mere alarms or signals? In exploring these questions, the goal was to uncover opportunities for multisensory engagement that do more than meet a checklist—they enrich the spatial experience for everyone.

THE DEAF AND HARD-OF-HEARING | SPATIAL COMMUNICATION

The third lens centered on the deaf and hard-of-hearing community. Here, the research expanded beyond the ADA and turned to Gallaudet University’s DeafSpace Guidelines, a comprehensive framework developed through decades of research and lived experience. DeafSpace offers a profoundly different way of thinking about architecture - not as a barrier to communication, but as a medium that can enhance and support visual interaction, spatial orientation, and a sense of belonging.

Unlike the ADA, which offers minimal guidance for this group beyond auditory alarm alternatives and visual signage, DeafSpace emphasizes the spatial dimensions of communication: sightlines, lighting quality, room proportions, and circulation patterns. These guidelines are not just about functionality, but about fostering community and cultural identity through design. As a result, Gallaudet’s work served as a powerful counterpoint to the ADA guidelines by being a more humanistic, culturally sensitive model for inclusive architecture.

This dual analysis of both the ADA and DeeafSpace guidelines offered a critical foundation for the speculative approach of this thesis. By placing the ADA and DeafSpace in conversation with one another, and filtering both through the specific needs of these three user groups, the research revealed both the strengths and the severe weaknesses of current accessibility standards.

MOVING FORWARD

The findings from this early research phase laid the groundwork for the rest of the thesis. It became evident that while regulations like the ADA are necessary, they are not sufficient. They represent a starting point, not a destination. True accessibility requires not only adherence to standards, but also a shift in design thinking toward a model that embraces accessibility as a design catalyst rather than a constraint.

Understanding these standards through the lenses of wheelchair users, the visually impaired, and the deaf and hard-of-hearing community allowed this thesis to move forward with a deeper sense of responsibility and purpose. It highlighted the gaps in current practices and began to chart a new path forward - one where inclusive design is not merely functional, but fundamentally enriching and imaginative.

WHEELCHAIR USERS

The built environment often presents persistent physical barriers for individuals who use wheelchairs. While the Americans with Disabilities Act (ADA) has led to widespread implementation of basic accessibility standards-such as minimum door widths, ramp slopes, and bathroom configurations-these requirements often reflect a narrow understanding of disability as a set of uniform needs. In practice, many spaces remain only marginally accessible, favoring compliance over true usability. Challenges such as inadequate maneuvering space, poorly integrated accessible routes, and the relegation of accessible entries to secondary locations continue to marginalize wheelchair users. This section examines the existing ADA standards relevant to wheelchair accessibility and visualizes them through rendered diagrams to critically assess both their successes and limitations in facilitating genuine inclusivity.

DEAF AND HARD-OF-HEARING INDIVIDUALS

Unlike physical mobility or tactile navigation, the accessibility needs of deaf and hard of hearing individuals are often less visible and as a result, frequently underprioritized in architectural design. The ADA primarily focuses on communication access, such as visual alarms or assistive listening devices, but offers little guidance on how spatial design itself can support deaf users’ daily experiences. The DeafSpace guidelines, developed by Gallaudet University, offer a compelling alternative: a set of spatial principles grounded in Deaf culture and visual communication. These include techniques such as soft lighting, transparent or reflective surfaces to expand visual awareness, and rounded corners to provide better visibility around intersections. Though these strategies can greatly enhance spatial safety and communication for deaf individuals, they are not required by current ADA standards. This section reviews existing ADA provisions alongside the more nuanced DeafSpace design strategies, offering visualizations that underscore the potential of an environment designed with visual engagement at its core.

BLIND AND VISUALLY IMPAIRED INDIVIDUALS

For blind and visually impaired individuals, spatial navigation is often shaped by sensory cues beyond vision, such as texture, sound, and contrast. While the ADA does address certain accessibility needs for this group - like tactile signage and detectable warnings at curb ramps - it largely overlooks a broad range of design strategies that could significantly enhance spatial orientation and independence. Techniques such as varying floor textures to signal transitions between spaces, or utilizing high-contrast colors for walls, doors, and signage to aid those with low vision, are not required by ADA guidelines despite their proven effectiveness. This omission reflects a broader issue: a lack of holistic, sensory-aware thinking in mainstream architectural standards. This section explores both the existing requirements and the underutilized design techniques that could transform how blind and visually impaired individuals experience the built environment.

SITE SELECTION | WHY NYC?

When deciding where to situate this research, I chose to focus on the urban fabric - specifically, a dense metropolitan environment - because it presents some of the most complex and layered challenges for accessibility. Urban settings are often characterized by congested spaces, high population density, constant movement, and the continuous interplay between pedestrian, vehicular, and commercial activity. In addition, the built environment in these areas tends to emphasize verticality, mixed-use development, and historic infrastructure, all of which can challenge the accessibility of the built environment for individuals with disabilities.

New York City, as one of the most populous and architecturally diverse cities in the world, presents a unique case study for examining the intersection of accessibility and urban design. The city’s scale, density, and pace intensifies the spatial and sensory demands placed on its residents and visitors - making it an especially critical context for rethinking inclusive architectural strategies.

While NYC has committed to becoming more accessible by 2028 through initiatives focused on (1) physical access, (2) digital access, (3) effective communication, (4) programmatic access, and (5) workplace inclusion, significant barriers remain in place today. Public transit infrastructure, uneven sidewalks, inaccessible building entrances, limited visual and tactile cues, and a general prioritization of efficiency over inclusivity are just a few of the ongoing challenges that disproportionately affect people with disabilities.

In fact, a 2024 Forbes article ranked New York City as the fifth most inaccessible city in the United States. This ranking reflects the cumulative effect of these physical, sensory, and systemic barriers and underscores the urgent need for more comprehensive accessibility strategies in urban environments. The reasons behind this ranking become evident in the following mapping analyses, which aim to highlight the spatial inequalities that persist across New York City’s built environment and identify opportunities for more inclusive design interventions.

By situating this research in New York City, the thesis engages with the real-world constraints and potentials of urban accessibility, using one of the world’s most dynamic and demanding environments as a lens through which to explore more inclusive architectural futures.

Mapping Exercise 01
The Distribution of Disabled Populations in New York State and City

This first mapping exercise investigates the geographic distribution of the disabled population across New York State, with a specific focus on New York City. According to recent data, approximately 3.9 million disabled individuals reside in New York State. Of that total, 2,073,555, or roughly 53%, live within the boundaries of New York City. This concentration is striking when placed in spatial context: New York State spans 54,556 square miles, while New York City occupies only 302.6 square miles, or just 0.55% of the state’s total land area.

This means that more than half of the state’s disabled population is concentrated within less than 1% of its landmass, highlighting an extraordinary population density of individuals with disabilities in New York City. This spatial reality emphasizes the need for robust, thoughtful, and comprehensive accessibility infrastructure within the city, far beyond what might be assumed based on geographic area alone.

In addition to its residential population, New York City welcomes approximately 65.2 million tourists annually. It is estimated that 9.7 million of these visitors are disabled, further intensifying the demand for accessible urban systems that can serve both residents and tourists with diverse mobility, sensory, and communication needs.

In response to some of these needs, the city launched Access-A-Ride in 1990, a paratransit service managed by the Metropolitan Transportation Authority (MTA), to provide door-to-door transportation for people with disabilities who cannot use the fixed-route subway or bus systems. Today, Access-A-Ride serves more than 500,000 riders each month, completing an average of 28,000 trips on weekdays. Services like Access-A-Ride are not just beneficial, they are essential. They provide critical mobility, autonomy, and connection to the urban environment for people who might otherwise be excluded from full participation in city life.

Given the immense concentration of disabled individuals living in or visiting New York City, this mapping analysis underscores the urgent need for accessible infrastructure, not as a secondary consideration, but as a central design and planning priority.

Mapping Exercise 02
Breakdown of Disability Categories in New York City

While the first mapping exercise revealed the overall number of disabled individuals in New York City (2,073,555), this next phase breaks that figure down by specific disability types. As previously mentioned, this thesis focuses on a subset of that population, including those with ambulatory, low vision, and hearing disabilities. To clarify the scope of the research, it is important to understand how these groups fit within the six main disability categories recognized by New York State, outlined below with their respective New York City population counts.

Cognitive Disability | 378,279 individuals
Refers to limitations in mental functioning, including difficulties with memory, problem-solving, attention, and comprehension that affect everyday activities.

Ambulatory Disability | 599,151 individuals
Includes those who experience serious difficulty walking or climbing stairs. This group primarily comprises wheelchair users and others with limited physical mobility.

Independent Living Disability | 443,470 individuals
Describes individuals who face challenges performing tasks that enable them to live independently, such as managing finances, transportation, or scheduling medical appointments.

Self-Care Disability | 276,266 individuals
Refers to difficulty with basic personal care tasks such as bathing, dressing, or feeding oneself.

Low Vision (Visual) Disability | 197,667 individuals
Encompasses individuals who are blind or have serious difficulty seeing, even when wearing glasses.

Hearing Loss (Auditory) Disability | 178,722 individuals
Includes individuals who are deaf or have significant difficulty hearing, even with the use of hearing aids.

Out of these categories, this thesis focuses specifically on the ambulatory, low vision, and hearing loss populations. Together, these three groups total approximately 975,540 individuals, which constitutes roughly 11% of New York City’s total population of 8,736,402.

This statistic is particularly important because, although the thesis addresses only a portion of the overall disabled population, it still represents more than one in every ten residents of the city. This underscores the scale and urgency of ensuring that the built environment supports accessible design not just for compliance, but for equity, dignity, and full participation in urban life.

Mapping Exercise 03
Distribution of Disabled Populations by Neighborhood

The third mapping exercise examines the percentage of disabled residents across different neighborhoods in New York City, revealing clear spatial patterns and clusters of disability density. This analysis identifies notable concentrations of disabled populations in areas such as the Bronx, Harlem, Coney Island, and parts of Queens. These neighborhoods stand out for having significantly higher percentages of disabled residents compared to other parts of the city.

The emergence of these dense clusters raises several important and complex questions:

  1. Are these areas home to more accessible housing or public spaces?

  2. Is affordability playing a role in concentrating disabled populations in these neighborhoods?

  3. Do these locations offer better access to accessible public transit or support services?

These are not questions that can be answered through a single dataset or map. To better understand the forces shaping these patterns, additional mapping exercises were developed to explore factors such as housing affordability, transit accessibility, and the distribution of public services and infrastructure.

It is essential to view the maps that follow not as isolated studies, but as interrelated pieces of a larger puzzle. Each one offers a different lens through which to interpret the spatial realities faced by disabled New Yorkers. Taken together, these layers help build a more complete and nuanced understanding of the systemic factors that influence where and how disabled individuals live, move, and interact within the city.

By continuously referencing this neighborhood-based population map in relation to other data layers, the thesis aims to build a more holistic narrative, one that moves beyond demographic statistics and toward deeper spatial insight into accessibility, equity, and urban life.

Mapping Exercise 04
Median Income by District

The fourth mapping exercise examines the median income levels within each district of New York City. When viewed alongside the previous map detailing the distribution of disabled residents by neighborhood, a striking correlation emerges: areas with the lowest median incomes, notably the Bronx, Harlem, Coney Island, and parts of Queens, are also the areas with the highest concentrations of disabled individuals.

This overlap suggests a deeper, systemic relationship between disability and economic inequality. There are several potential explanations for this pattern:

  1. Limited Economic Opportunities: Individuals with disabilities often face barriers to stable, well-paying employment due to discrimination, lack of workplace accommodations, or insufficient support services. This can lead to long-term income disparities and economic vulnerability.

  2. Affordable Housing Clusters: Lower-income neighborhoods tend to offer more affordable housing, which may be one of the few viable options for many disabled residents living on fixed incomes such as Social Security Disability Insurance (SSDI) or Supplemental Security Income (SSI).

  3. Historic Disinvestment: Many of these neighborhoods have experienced decades of underinvestment in infrastructure, housing, and healthcare, factors that both contribute to and exacerbate health and mobility challenges among their populations.

  4. Spatial Concentration of Services: In some cases, disability support services and community resources may be more readily available in lower-income neighborhoods, creating a pull factor for disabled individuals seeking proximity to care networks or community-based organizations.

The intersection of low income and high disability density raises important concerns about compounded disadvantage in the built environment. These communities are not only under-resourced economically, but also disproportionately bear the burden of inaccessibility due to limited transit options, poor sidewalk conditions, aging infrastructure, and inadequate housing stock.

This mapping exercise emphasizes the need to approach accessibility through a socioeconomic lens. Creating an inclusive city requires not only improving design standards, but also addressing the economic inequities that shape where disabled individuals live and how they experience urban life.

Mapping Exercise 05
Zoning and Inclusionary Housing in New York City

The fifth mapping exercise explores New York City’s zoning landscape, with a specific focus on the distribution of Voluntary Inclusionary Housing (VIH) and Mandatory Inclusionary Housing (MIH) developments. These zoning tools are designed to increase the availability of affordable housing and promote greater socioeconomic diversity across neighborhoods.

What is Inclusionary Housing?

  1. Voluntary Inclusionary Housing (VIH):
    This program allows developers in certain high-density zoning districts to receive zoning bonuses, such as increased floor area, if they set aside a percentage of residential units as permanently affordable. While not required, this incentive-based model encourages the private sector to integrate affordable housing into new developments, particularly in high-demand areas.

  2. Mandatory Inclusionary Housing (MIH):
    Unlike VIH, this program requires developers in designated rezoned areas to include a specific percentage of affordable housing units in any new residential construction. The MIH program helps ensure that as neighborhoods are upzoned to accommodate growth, affordable housing is built alongside market-rate units.

VIH and MIH programs play a key role in expanding affordable, and potentially more accessible, housing for disabled New Yorkers, many of whom live on limited incomes. By increasing the supply of below-market-rate housing in well-connected neighborhoods, these policies can help disabled residents access better-located and higher-quality homes.

It is encouraging to see Voluntary Inclusionary Housing in higher-income areas of Manhattan and Brooklyn, where access to transit and public services is stronger, which is especially important for people with mobility, vision, or hearing impairments. It is also encouraging to see similar trends within Mandatory Inclusionary Housing. However, both programs remain concentrated in lower-income areas such as the Bronx, Harlem, Coney Island, and parts of Queens, which also have higher populations of disabled residents.

While these programs do not guarantee accessibility, their thoughtful placement can help reduce geographic segregation and support more inclusive housing opportunities across the city.

Mapping Exercise 06
NYC Pedestrian Mobility Plan and Corridor Classification

This mapping exercise analyzes the NYC Pedestrian Mobility Plan, created by the Department of Transportation to guide sidewalk design based on anticipated pedestrian activity. In a city where walking is the primary mode of transportation, this plan provides a data-driven framework aimed at improving safety, comfort, and accessibility.

At the heart of the plan is a corridor classification system, which categorizes streets into five types based on nearby pedestrian generators such as transit stations, businesses, schools, and parks:

  1. Baseline Street: Low foot traffic, typically residential (approximately 60% of streets)

  2. Community Connector: Moderate use, connecting homes to small destinations (approximately 25%)

  3. Neighborhood Corridor: Consistent pedestrian activity near local hubs (approximately 12%)

  4. Regional Corridor: High pedestrian volume near major attractions (approximately 2.5%)

  5. Global Corridor: Very high foot traffic serving global destinations such as Times Square (less than 0.5%)

Each street type is assigned recommended sidewalk dimensions, divided into three zones:

  1. Furnishing Zone: For trees, benches, bike racks, and other streetscape elements

  2. Walk Lane: The main pedestrian movement area

  3. Clear Path: Unobstructed space intended to support smooth, accessible passage

While the widest sidewalks are generally found in central Manhattan, where tourism and commercial activity are most concentrated, outer-borough neighborhoods such as the Bronx, Harlem, Coney Island, and parts of Queens, which have higher concentrations of disabled residents, often lack this level of infrastructure. This mismatch creates challenges for several groups:

  1. Wheelchair users, who require wide and unobstructed paths

  2. Blind individuals, who rely on consistent and obstacle-free routes

  3. Deaf individuals, who benefit from open space for signing and visual awareness

This analysis highlights a central issue: pedestrian infrastructure is often prioritized by volume rather than by need. To create a truly accessible city, wider sidewalks and thoughtful street design must extend into the neighborhoods where they are most needed, not only where they are most heavily used. By connecting this data with the previous mapping exercises, the thesis underscores the importance of embedding accessibility into every layer of urban planning, from sidewalks and transit to zoning and housing.

Mapping Exercise 07
Pedestrian Accessibility Signals and Curb Ramps

This mapping exercise examines pedestrian mobility infrastructure across New York City, focusing on two key accessibility features: curb ramps and accessible pedestrian signals (APS).

On the map:

  • Blue dots represent curb ramps at street intersections. These are present at nearly every intersection, which aligns with ADA requirements. This is a positive reflection of the city’s compliance with baseline accessibility standards.

  • Pink dots mark intersections with audio cues and accessible pedestrian signals, which are crucial for blind and low-vision individuals to cross the street safely.

Unlike curb ramps, APS installations are not distributed consistently across the city. The map reveals clear gaps, especially in neighborhoods with lower incomes and higher concentrations of disabled residents, including much of the Bronx, Harlem, Coney Island, and parts of Queens.

In contrast, areas such as Downtown Brooklyn, DUMBO, and much of Manhattan, which tend to have higher median incomes and lower percentages of disabled residents, show a greater density of these accessible signals. This points to a troubling imbalance: the areas most in need of accessible infrastructure often receive the least.

Furthermore, Manhattan, as a major commercial and transit hub, is frequented by New Yorkers from all parts of the city. The lack of widespread APS coverage in such high-traffic areas affects not only local residents, but also the broader disabled population navigating the city for work, transit, and recreation.

Accessibility should not be determined by neighborhood affluence. These signals are essential tools for safe, independent navigation and should be implemented equitably across the urban fabric, not just in more privileged areas. A truly accessible city must go beyond minimum standards and ensure that mobility infrastructure reflects both the presence and the needs of its most vulnerable users.

Mapping Exercise 08
MTA Subway Accessibility

This mapping exercise focuses on subway station accessibility across New York City. On the map:

  • Pink dots represent accessible subway stations.

  • Blue dots represent inaccessible stations.

Currently, only about 30% of all subway stations are accessible, a deeply limiting reality for disabled residents, commuters, and tourists. This lack of access effectively excludes many individuals from using one of the city’s most vital forms of transportation.

The map reveals a familiar pattern: there is a higher concentration of accessible stations in Manhattan, as well as in Downtown Brooklyn and DUMBO, areas previously identified as having stronger pedestrian accessibility infrastructure. These neighborhoods also tend to have higher median incomes and lower percentages of disabled residents, highlighting a recurring equity gap.

While it is important that commercial and office hubs are accessible, since people commute to these areas for work and services, there remains a serious lack of accessible stations in the outer boroughs and lower-income neighborhoods. Areas such as the Bronx, Harlem, Coney Island, and parts of Queens, which are home to larger disabled populations, continue to face limited transit connectivity.

To create a more equitable and navigable city, subway accessibility must be expanded beyond the city center, ensuring that marginalized and harder-to-reach communities are not left behind. Transportation should be treated as a universal right, not a selective privilege.

Mapping Exercise 09
Bus Routes and Stop Accessibility

This mapping exercise examines New York City’s bus network, highlighting bus stops (yellow dots) and routes (orange lines) across the five boroughs. The map reveals a comprehensive and well-distributed system with strong geographic coverage that, on the surface, suggests promising access to public transit.

However, this raises an important question: how accessible are these bus stops in practice?

While the network itself is extensive, physical access to the stops can vary greatly. For individuals with disabilities, particularly wheelchair users or those with visual impairments, reaching a bus stop that is not directly on their street may involve navigating uneven sidewalks, missing curb ramps, or a lack of directional cues. Without clear wayfinding, tactile markers, or smooth and continuous paths, even a short trip to a nearby bus stop can become a significant barrier.

This mapping exercise underscores the idea that coverage alone is not enough. To make the bus system truly accessible, there must be equal attention given to the journey to the stop, which requires ensuring that sidewalks, crossings, and signage support all users in reaching and using the transit system safely and independently.

Mapping Exercise 10
Ferry Stops and Routes

This exercise maps NYC Ferry infrastructure, with purple dots representing ferry stops and purple lines indicating ferry routes. While ferries are often overlooked as a mode of public transit, they offer a unique opportunity for waterfront and inter-borough travel.

One key limitation is that ferries primarily operate along the edges of the city, connecting outer boroughs to one another rather than moving passengers through the urban core. As a result, most ferry users must rely on a secondary mode of transportation, such as the subway, bus, or rideshare, to reach their final destination.

However, one encouraging takeaway is that all NYC ferries are currently accessible, generally making them a viable option for disabled riders. With improved integration between ferry terminals and other transit networks, ferries could become a more valuable part of the city’s accessible transportation system.

To fully realize their potential, future planning should prioritize multimodal connectivity, ensuring that ferry stops are clearly and easily linked to accessible bus stops, subway stations, and pedestrian paths.

Mapping Exercise 11
Comparative Analysis of NYC Transit Usage (2018–2023)

This final mapping exercise compares average daily ridership across several transportation modes in New York City from 2018 to 2023, including:

  1. NYC taxis

  2. Ridesharing apps such as Uber and Lyft

  3. NYCT/MTA buses

  4. NYC MTA subways

  5. NYC ferries

Across all systems, the data clearly shows a sharp decline in ridership during the COVID-19 pandemic, particularly between 2019 and 2021. Public transportation usage dropped significantly during this period, reflecting health concerns, changes in travel behavior, and citywide shutdowns.

However, ridesharing apps experienced one of the fastest rebounds in the post-pandemic period, with a noticeable increase in users beginning in 2021. This rise suggests a growing preference for personalized, door-to-door transportation, which may be especially helpful in a city where accessibility across transit infrastructure remains inconsistent.

Despite the rise in ridesharing, traditional public transit modes continue to serve far more people on a daily basis:

  1. Subways: 3,654,326 daily riders (2023)

  2. Buses: 1,082,428 daily riders (2023)

  3. Ridesharing: 638,161 daily riders (2023)

While it is difficult to determine what percentage of these riders are disabled, it is reasonable to infer that ridesharing services, along with programs such as Access-A-Ride, may be more feasible or even essential for many individuals with disabilities, especially given the barriers present within the subway and bus systems.

This comparison highlights the critical role of flexible, on-demand transportation in supporting more equitable urban mobility. Moving forward, integrating accessible ridesharing and paratransit options more directly into the city’s broader transportation ecosystem could significantly improve mobility for disabled residents and visitors alike.

Next
Next

Preserving the Archipelago